Introduction in QGIS 3: Presentation of Geographic Information (Chapter 5)
OpenSchoolMaps.ch — Free learning materials for free geodata and maps
A worksheet
Presentation and output of data
In the last few chapters you’ve learned how geodata is captured, managed and analyzed. In the last chapter it’s about the P of EVAP, the presentation of the data.
Learning objectives
After this chapter you will be able to do the following:
-
output the results of your queries in GIS in suitable form
-
name the important map elements
Theory
There are different possibilities to present or provide the visualized, newly recorded or changed data or results of queries and manipulations to others.
Here is a selection of them:
-
A method, that has been used for a long time and still is very popular, is the paper plan. Especially on construction sites paper plans are still often used. To create a paper plan, you can use a map in a print layout or a layout view in GIS and then print it out on paper.
-
The plan, which was created in the print layout, can also be stored as PDF and then e.g. be forwarded by e-mail.
-
Another method, which is becoming more and more popular, is the representation of geodata on the Internet in a so-called Web-GIS or Internet-GIS.
-
In addition, the results of analyses can also be output in form of tables or graphics.
Two of these output types we’d like to look at more accurately with some examples.
Internet or Web-GIS
Click on the following link, to access the Web-GIS of the Canton of Zurich:
![]() Task 1
Task 1
Answer the following questions: Which GIS functions are used in this Web GIS
offered? Which data can be considered?
![]() Task 2
Task 2
I’m sure there’s also from canton of residence or from the neigboring
canton a WebGIS on the Internet. Check this out by using Google. Search for
your canton of residence or the neigboring canton in the surrounding and the
terms "GIS" and "Online". Note the link.
Printed map or map in PDF format
![]() Task 3
Task 3
Look at these cards and write down, which elements next to the data belong on
a card. Think about each element that you’re writing down, what purpose it
serves.
-
Map of Thun from 1935: http://www.zumbo.ch/maps/navigate/navigate.php?map_nr=62&lang=de
-
OL Map Gwattholz: http://www.omstrom.ch/images/olkarten/gwattholz_11.pdf
![]() Task 4
Task 4
Create a concept for your own card using the findings from the cards you are
looking at. This concept then applies to in the exercise part. The concept
should consist of a sketch in which the position of the map and the map
elements is determined. Also, consider the following points when designing.
Points:
-
what topic would you like to present?
-
what’s the card supposed to say?
-
whom do you want to address with your card (user group)?
Are you satisfied with your concept? Then it’s on to the implementation of this draft.
QGIS Exercise
In this last exercise, the map design from the theory part will be implemented in GIS.
Learning objectives
At the end of this exercise you should have mastered the following points:
-
Using QGIS, create a map that contains all important map elements
-
Depending on the purpose of the card, select a suitable output format and justify your choice
Print composition
Before you can start creating the map, you must design the section of the map window as you would like it to appear on your map. This includes showing and hiding layers, depending on whether you want to display them on the map or not. When you are satisfied with the presentation and the detail, you can continue with the exercise.
There is a separate mask for creating a map. Open it via the menu Project → New Print Layout….
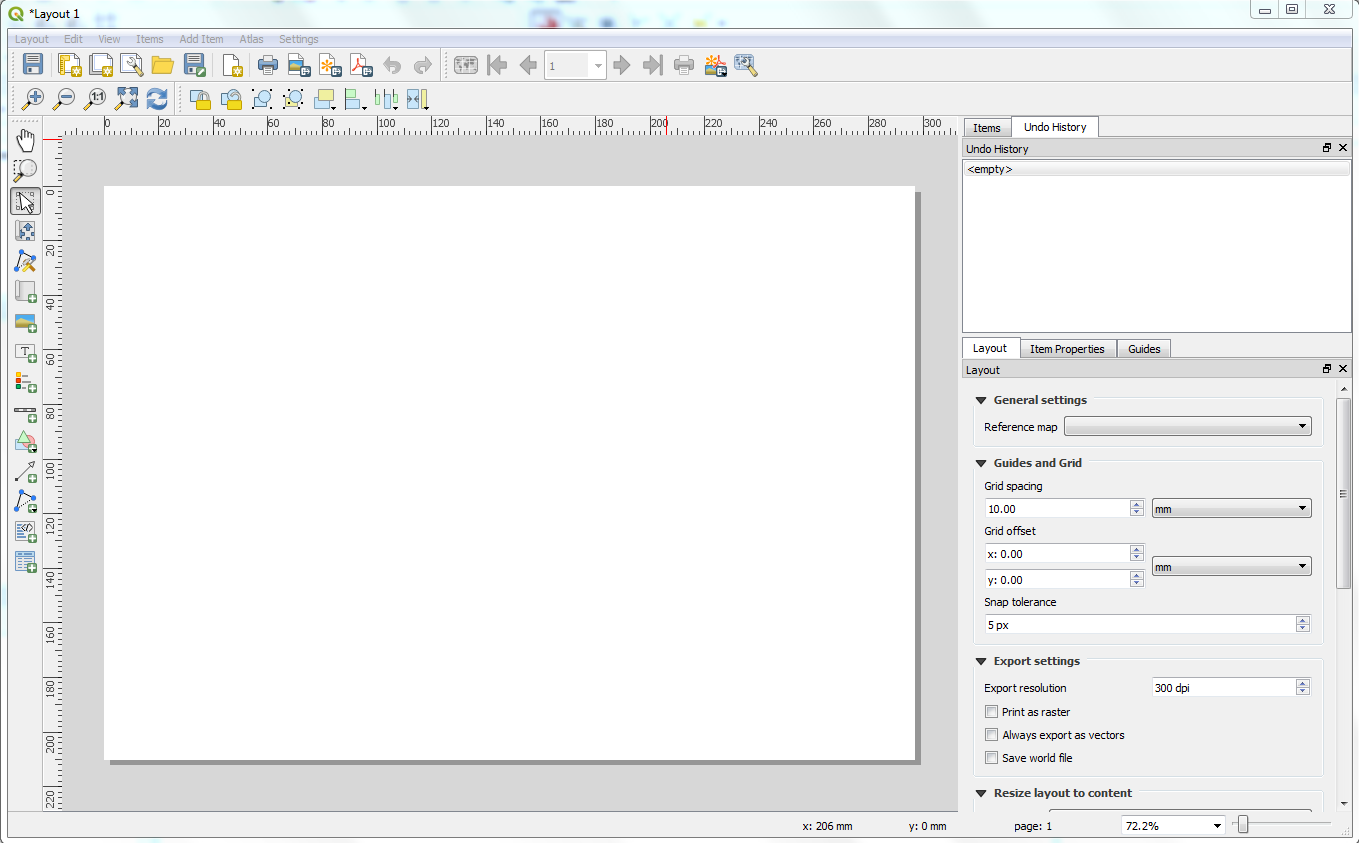
The mask is structured in such a way that the menus and tools are again located in the upper area. The middle part is divided into two areas, on the left side is the map window, in which the map can be designed, and on the right side the corresponding parameters can be set and settings made.
On the right side there are three tabs, one named Layout, one named Item Properties and one named Guides. Under Layout you can make settings that affect the whole map. In contrast, the settings under Item Properties only affect the currently selected element (e.g. map or legend).
Before you start designing the map, right-click on the white map and select Page Properties. This should select the Page Properties tab on the right side, which you can then use to select the paper format for the map you want to design. Under Size you have a choice of common paper formats as well as the option Custom, with which you can create your own format. Leave this setting at A4.
Under Orientation you can choose between Landscape and Portrait. Choose the format, which you have chosen in the theory part for your map design.
It also makes sense to place a grid over the map sheet where you can align the elements you place on the map. You have to activate the options Show Grid and Snap to Grid in the menu bar View and set the Grid spacing to 10.00mm under the tab Layout → Guides and Grid.
Thus the general settings are made and it can be begun with the map organization.
First the layers should be displayed in the map. Click on the Add Map button and draw a frame in the size you have chosen in your map design. The map section and the layers you selected at the beginning of the exercise will appear.
With the help of the button Select/Move item the new map can be selected and the size can be changed by clicking on the border. Additionally the map can be moved in the print compilation. The size can also be determined in the Item Properties tab under Position and size by entering Width and Height.
The Move item content button can be used to move the content of the map. Under the Item Properties tab under Main properties you can also set the scale (Scale) and the rotation angle (Map rotation) of the map. If the coordinates of the extent of the section to be displayed are known, they can also be entered under Extents.
In addition, the option can be selected under Grids whether a grid should be displayed above the map. For example, this grid can be of type Cross or Solid and additionally labeled. For Switzerland a grid interval of 25'000 m or 50'000 m would be suitable.
Under Frame you can determine whether the frame around the map element should be displayed and if so, in which color and which line width.
Design your card element with the described possibilities. If you are satisfied with your result, you can save your settings by clicking the Save project button.
Then add the other map elements you have on your design. The buttons can be found in the toolbar. If an element has been added, you can adjust these elements under the Item Properties tab.
Are you done with your card and satisfied with what it looks like? Then check again to see if your card really contains all the important card elements. Is the copyright for the data included? If so, then there’s nothing standing in the way of bringing the card into a format that is suitable for distribution.
Prepare card for transfer
The map can be saved as a raster or as SVG, exported as PDF or printed on a printer. Saving in raster format can be used, for example, if the map is to be included in a report. If you want to forward the map by e-mail, the PDF format is well suited. Often, however, printed plans are still used. Therefore you have this option in the mask Printer composition
In this exercise, a plan in the form of a PDFs is to be created. Therefore, click the Export as PDF button, select the location and start creating the PDF. If the map also contains a WMS service that is to be saved, the quality must be reduced in the Layout tab under Export settings before the PDF is created, depending on the zoom level used.
Take a look at the map again in PDF format. Satisfied with it? Then it’s time for the last chapter test.
Chapter test 5
With the knowledge you acquired in the last chapter, it should be possible to answer the questions of the last chapter test. Write the answers to the questions again in your notebook or on a piece of paper. When you have answered all the questions, give the sheet to your teacher for correction.
Question 1
Let’s come back to the situation from question 4 of chapter test 3: Your class teacher instructs you to create a GIS for the next school trip, on which the different intermediate stations of the trip and the hiking route are spatially represented. At the end you should pass on the GIS map to the other students in some way.
-
Which output format do you choose for the card?
Write down your choice and explain it in your own words. There are several real possibilities. -
How do you design the card in QGIS?
Describe your actions in your own words. Do not look in the last chapter. However, you are welcome to go through the individual steps while writing in the QGIS program. Assume in your explanation that the data has already been read into the GIS or newly entered and that the design of the layers has already been completed.
Question 2
Again and again, be it in newspapers, books or on the Internet, the spatial
relationships between data and events in a report are visualized with the help
of a map. But do these maps also contain the most important map elements?
You got to know these elements in this chapter and made your own experiences
with the design of a card. Look at the map under the link
http://www.mygeo.info/landkarten/schweiz/schweiz_cia_2005.gif
and answer the following questions:
-
Are all important map elements included in the map? If not, which ones are missing?
Create a list of all existing and non-existing map elements. Also consider the effects of missing map elements. -
How do you assess the implementation of the map and the presentation of the information?
What’s the card supposed to say?
Answer the question in your own words. When answering the question, also think of your own experiences that you made when designing your card.