Introduction to QGIS 3: Data collection and Management (Chapter 3)
OpenSchoolMaps.ch — Free learning materials for free geodata and maps
A worksheet - SOLUTIONS
You have probably already entered data in a table (e.g. an Excel spreadsheet).What kind of data did you enter? Where did the values you entered come from? Where could values come from in general terms that are stored in a table? As an introduction to this chapter, think about these questions for two to three minutes. Make a note of them on your worksheet. Go on in this chapter only then.
Learning objectives of the theory
This chapter has the following learning objectives:
-
explain the structure of a table in your own words
-
list at least 4 types of data acquisition without tools
-
show in your own words why it is worth investing money and time in data acquisition and management.
Theory
In the chapter Geodata and spatial reference we have seen that there are generally two ways to store geodata: In the form of vector data and raster data. Since you will probably save the data you collect as vector data in future GIS projects, this chapter will also deal with the collection of vector data.
Table
First, however, we will deal with the general recording of values in tables. A table consists of rows and columns. The row is horizontal and the different datasets are stored in it. The column is vertical and a certain property of a data set is stored in it.
Tables are often used to store values from measurements. For example, the number of students in a class can be stored in a table. The number of students of a class can be counted. In addition, the class teacher could also be entered in the table. The corresponding table would then look as follows.
| Class | Number of students | Teacher |
|---|---|---|
1c |
22 |
Gaby Meyer |
2b |
24 |
Franz Peter |
… |
… |
… |
The names of the columns (e.g. class, number of students…) are called attributes.
For geodata, the geometry must also be saved in addition to the attributes. In the previous exercises you already got to know the shapefile as a storage type for geodata. With the Shapefile, the geometry and the attribute data are saved in different files.
Open the directory in which the data for the exercise is stored and take a closer look at the data. In addition to the main file with the extension .shp there are other files with the same name but a different extension. For example, the file with the extension .dbf contains the factual data and the file with the extension .prj contains the coordinate system. All these files together form the shape file.
The geodata can also be stored in special databases, so-called geodatabases. These databases function similarly to normal databases, but additionally offer the possibility to manage geometry as well as factual information. Normal databases cannot do this. Examples for geo databases are e.g. Oracle Spatial and PostGIS.
Data acquisition
Now you have learned in which form geodata can be saved. But how do you get from the objects in the real world to the information you want to store?
![]() Task 1
Task 1
Think for two to three minutes about what sources the data might come from
and what collection methods you know. Continue in the text only then.
Compare your solution with the data collection possibilities from theory.
There are many methods to capture geodata. We would like to briefly discuss some of them.
-
In part 1 of this guidance program, the example with the mobile phone with integrated GPS was used. Besides measuring with tachymeters, GPS is a popular method in surveying to record the geometry of objects in the field. Often the result of measurements has to be read into the GIS project as a text file containing coordinate and attribute values.
-
Aerial images are often used as background images.
-
Often plans are still available in analogue form, i.e. as paper maps. In order to convert these plans into digital form, they must be scanned. After scanning, the data is digital, but has no spatial reference. In order to obtain a spatial reference, they must also be georeferenced (see chapter Geodata and spatial reference).
-
Aerial photographs and digitized and georeferenced plans often provide a good basis for converting objects into vector format. This process is also called vectorising.
-
Some data have already been collected in another GIS project. Some of these data can be transferred without adjustments. Often the data format or the coordinate system have to be adapted or additional attributes have to be entered.
-
Statistical offices publish a large number of statistical surveys. These statistical data can be imported and linked to the corresponding geometric objects, such as cantonal boundaries, in order to obtain a spatial reference.
Data acquisition and management usually takes a lot of time. But the effort is worth it, because the data can be regarded as the core of the GIS. If the quality of the data is poor or the data is incomplete or outdated, the results of the evaluations or the maps created from the data are correspondingly poor.
Compared to the other GIS components software and hardware, the data have a very long service life. While better and faster computers are coming onto the market and the software products are usually outdated after a few years, the data can be used for decades.
Since the collection is very complex, one is naturally also interested in being able to use the data as long as possible. In order to guarantee this, regular updating is just as important as good and clean data collection. The principle "as accurate as possible" does not apply to the collection of data, but "as accurate as necessary".
QGIS exercise
In the theory part you learned how to get the geodata you need for your GIS. In this exercise, you will integrate data from a text file into your GIS so that it can be spatially referenced and geographically represented. You will also update data in an existing dataset.
Learning objectives
When you’ve solved the exercise, you’ve learned the following:
-
spatially visualize a text file with coordinates in a GIS
-
label a layer with an attribute value
-
create new objects (geometry and attributes)
-
change the display of the data via the layer properties
Object from text file
The location of the cantonal capitals is stored in the text file Hauptorte.txt. Open this file in a text editor and take a closer look at the content.
![]() Task 2
Task 2
In what form is the location of them stored in locations and how is the
information separated from each other? Write your findings on your worksheet.
Solution
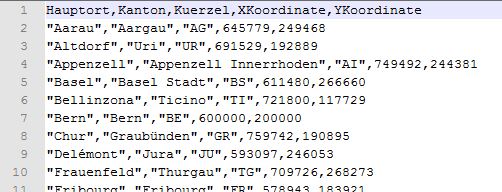
The position of the main locations is indicated by the X-coordinate
(X-coordinate) and the Y-coordinate (Y-coordinate).
The attribute names are stored in the first line of the text file. In our
case, these values are separated by commas.
From the 2nd line onwards, the captured objects follow. The attributes of the
individual objects are also separated by commas. A new object always starts on
a new line. For text values, quotation marks must appear at the beginning and
end of the value.
The first line defines which separators are used in the document. The characters selected there must also be used as separators in the rest of the document.
The Add Delimited Text Layer tool for reading coordinates from a text file can be found in the Manage Layers Toolbar toolbar. If you don’t know how to show toolbars anymore, have a look at chapter 1 again.
Open the new tool and first enter the type of separator that separates the information in the text file (see Result of the last task).
Then click on the … button and select the text file Hautporte.txt. The tool now automatically divides the text file into different fields, whereby the selected separator determines where the new field begins.
Below the geometry a suggestion appears automatically, which field should be used as X-field and which as Y-field. Compare the suggestion with your considerations. If you don’t agree, change the entry. Then click on the OK button to display the main locations in the project.
In order to be able to perform spatial analyses with the new Layer Main Locations later, the same coordinate reference system as the other layers must be assigned to the Layer. Open the Layer Properties of the main locations and search under Source: the correct CRS/KBS. Select the coordinate system CH1903 /LV03 with the EPSG-No. 21781.
If you now open the attributes table, you will see the information of the text file displayed in a table. Additionally a position in the map was calculated from the selected numbers for the X- and Y-coordinates and a point was placed there.
Labeling of a layer
Now the main locations are to be labelled. Open the Layer Properties window and select the Labels option. For Show labels select the Single Labels field and as Description field select the field with the name Main. Then adjust the font size, placement, clipping, etc. until the label fits "into the image". In addition, select more suitable point symbols for the main locations.
Change display colours
How satisfied are you with the colours of the lakes and cantons? Don’t you think that the light yellow colour would be better for the cantons and the blue colour for the lakes? To change the display color, right-click on the layer → Properties… or double-click on the layer to open the window called Layer Properties.
First of all, the representation of the cantons should be changed. Therefore open the Layer Properties window for the canton boundaries.
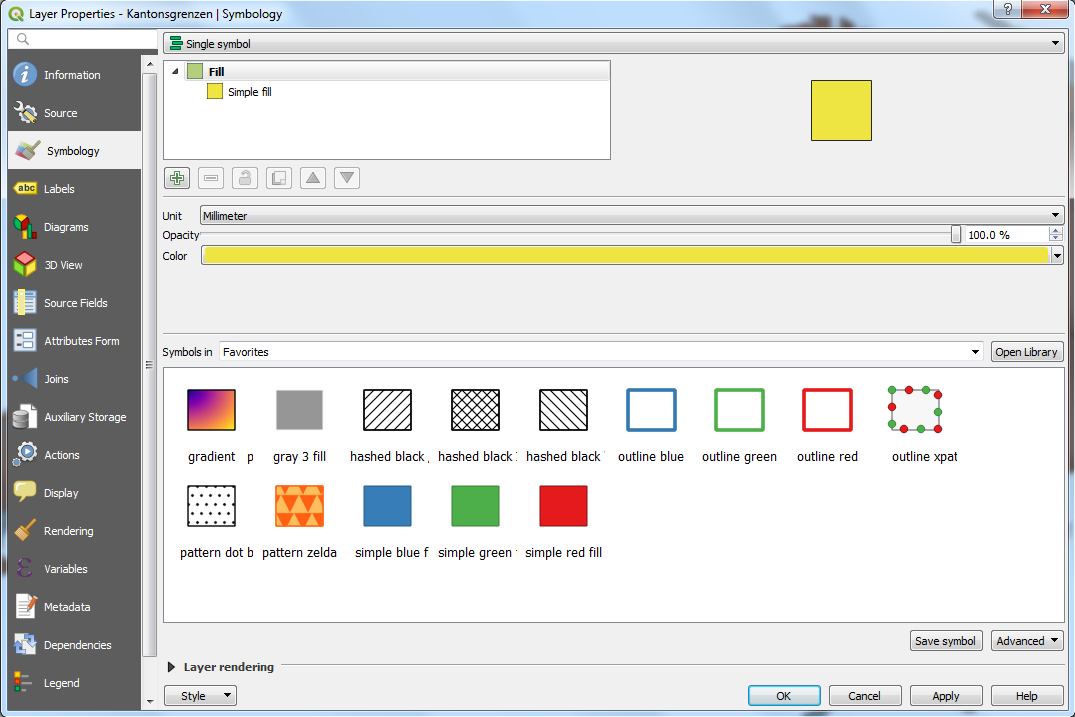
Check whether the Display option is selected in the selection window on the left. This will take you to a mask where you can change the fill color, type and border options in just a few steps. Try these options and choose a light yellow fill color and an orange border for the canton areas. By clicking on the Apply button you can view your settings in the map window. If you are satisfied, you can close the window by clicking the OK button.
The lakes are to be given a two-coloured filling. Open the window with the name Layer Properties for the lakes layer.
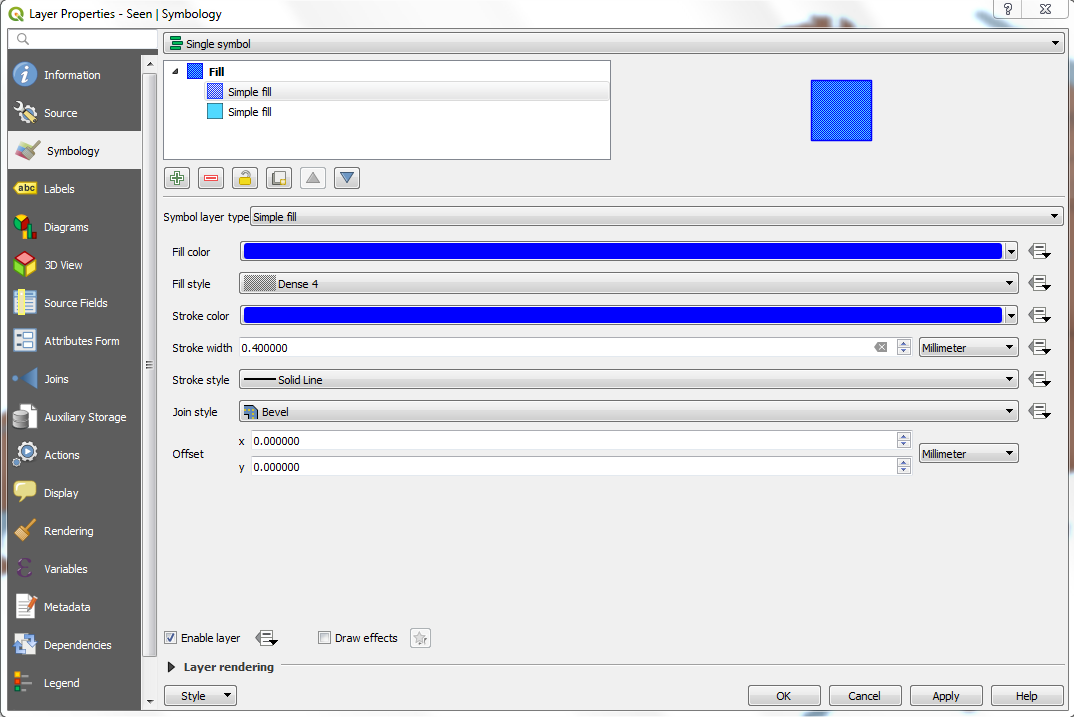
Create a second symbol layer by clicking on the + button. Select the fill color light blue and the fill style Solid for the lower layer and a darker blue as fill color for the upper layer than for the first layer and the option Dense 4 as fill style. The border color should be the same as the fill color and the border width should be 0.4. When you are satisfied with the fill, close both windows by clicking OK. Don’t you think that the map window looks much better now?
Locator bar
A new tool introduced in QGIS 3 is the Locator Bar.
In QGIS, the Locator Bar can be opened with the keyboard shortcut Ctrl + K.
With the Locator Bar you can search for actions, "computers" (calculation operations), processing algorithms and much more from QGIS.
Try the tool yourself by selecting the lakes layer and searching for a lake in
the Locator Bar. Use the prefix f for the search.
Example: f Greifensee
You can find the prefixes by opening the locator with Ctrl + K, or under Settings → Options… → Locator
Entering objects
In addition to the existing lakes, two further lakes are now to be included: the Lungernsee and the Wägitalersee.
To capture the Lungernsee, zoom near Sarnen. The lake between Giswil, Brienz and Meiringen is the Lungernsee. In order to collect data at all, the layer must be marked with the lakes and the Toggle Editing button must be selected from the Digitizing Toolbar toolbox. The same is done by right-clicking on the layer and then selecting the Toggle Editing option. Try both methods and decide which one you want to use in the future.
The buttons that can be used for digitizing are now activated. Select the Add Polygon Feature button and place points along the light blue line of the shore area on the map. To close the area press the right mouse button. A window appears automatically in which the attributes can be entered. Enter the following values:
Name: Lungernsee; Type: Speichersee;
Area: 2.01 km2; Height: 688.0 meters above sea level; Depth: 68 m; Volume: 0.065 km3
As already mentioned, the second lake to be covered is called Lakeägitalersee and lies between Lake Sihl, Lake Zurich and the village of Glarus. Also record the geometry and attributes of this lake. Here some more information:
Name: Wägitalersee; Type: Speichersee;
Area: 4.18 km2; Height: 900.0 meters above sea level; Depth: 65 m; Volume: 0.150 km3
To save the changes, the editing status must be changed again. As long as you do not do this, the data you have entered will not be saved.
Congratulations, you have captured your first objects yourself with QGIS!
Chapter test 3
Welcome to the chapter test 3. Meanwhile you are already an old chapter test rabbit and know exactly what to do. Therefore here without big words the questions:
Question 1
Vector data can be stored in different forms.
What two species do you know?
Write an additional sentence for each form in which you name a special feature.
-
Shapefile
The easiest and fastest way to store vector data are Shapefiles, which distribute their data to different files. -
Geo databases
Another form of storing vector data are special databases, so-called geodatabases. They differ from normal databases in that they can also be used to manage the geometry and not just the data.
Question 2
It is not only in a GIS that information is often stored in the form of a table.
How would you describe the structure of such a table to someone who has never seen one before?
You may also use a sketch to answer this question. The important terms, however, must be written in your answer.
Solution
ID |
First name |
Last name |
|
1 |
Elena |
Meller |
Elena.me@gmail |
2 |
Nina |
Schurter |
Nina.Schur@gmx |
3 |
Ben |
Schulte |
Ben.Schul@gmx |
4 |
Miriam |
Orler |
Miriam.orl@hotmail |
5 |
Lukas |
Gerber |
Lukas.gerb@gmail |
The above data is in the form of a table and is intended to serve as an
example to illustrate a table.
Tables are used to store information in an orderly manner. They consist of rows (horizontal) and columns (vertical). A row contains a so-called data set, also known as a tuple. A data set contains various data that belong together and are only meaningful together. In the example above, Elena Meller would be a data record with the email Elena.me@gmail and the ID 1. There are also columns that contain attributes, which in turn represent a subset of a data set.
Question 3
One way to store information about objects is to write them into a text file.
-
What has to be saved in a text file in order to display the information from the file in the map window?
-
What has to be considered when entering the values in the text file? Why does this have to be considered?
Answer the questions in your own words and justify your answers. Think back to the exercise when answering the questions.
-
Coordinate and attribute values must be available.
-
It must be ensured that the first line of the text file contains the attribute names separated by a comma. Then, in the following lines, follow the objects where the attributes are also separated by commas.
Question 4
Your class teacher will instruct you to create a GIS for your next school trip, in which the various intermediate stations of the trip and the hiking route are spatially represented.
What possibilities do you have to get the different dates?
Select two topics that you would like to present in the School Travel GIS. Answer the question for both topics. However, two different entry types must be described. There are several correct ways.
-
Stops of the public transport connections
Check the timetable and location of the stops on the homepage of the public transport providers and implement them in the GIS. -
Non-hazardous hiking trails through natural landscape
Analyse freely accessible aerial photographs (e.g. Bing Maps) and determine and draw the best possible route.