A Worksheet for interested individuals and Teachers
Overview
learning objectives
This introduction has the following learning objectives:
-
You know the most important concepts and basic functions of Apache Superset.
-
You know how to select data sources
-
You know how to visualize data using charts
-
You know how to arrange charts to a dashboard
-
You know how to share dashboards with others (over the web)
Editing this worksheet takes about two hours, depending on your previous knowledge.
No programming knowledge is required for this introduction; Basic knowledge of spreadsheets is sufficient for the time being.
For the exercises in this worksheet you need access to an Apache Superset service (see below), as well as a common web browser and an internet connection.
This guide refers to release 0.34 of Apache Superset, which was released in September 2019.
Introduction
Good visualization is important for the success of decision making. Therefore, the findings of a concern, project or survey must be visualized. If findings are presented in a clear and comprehensible way, this increases their comprehensibility and acceptance.
Visualization can not only be used for illustration, but also for data analysis. Frequently, connections in the data can only be identified by a skilful representation. We humans are bad at comparing numbers; graphic patterns, on the other hand, we recognize well. Visualization therefore not only represents the data graphically, but can also be used as a separate technique for data analysis. The Internet also makes it possible to publish the visualization and thus to communicate easily with customers and colleagues.
Apache Superset is such a data visualization and publication tool. Some also call this application "Business Intelligence Tool". Superset is also a tool for sharing data sources, i.e. from table data to geodata. It can be connected to various databases.
| Apache Superset has an official documentation in English. Unfortunately this documentation seems to be very thin and not updated: It uses obsolete terms ("slices" instead of "charts"). and the tutorial included in the documentation requires weather data that is not pre-installed. The most useful part of the documentation is the (small) FAQ Frequently Asked Questions: https://superset.incubator.apache.org/faq.html . |
Create user account / log in
Apache Superset is a web application and an account is required for access. If you already have access to Apache Superset, log in there.
Apache Superset knows several user roles that have certain rights to change data or call functions. In this worksheet it is assumed that you have obtained user rights corresponding to the "Gamma" role, i.e. you can create charts and dashboards.
The Geometa Lab HSR operates, among other things, "Apache Superset Cloud" as a "Software-as-a-Service". Apache Superset Cloud uses the PostgreSQL database system with the PostGIS extension and is subject to a fee (participants of Geometa Lab HSR continuing education courses receive their own access).
Concepts and terms
After logging in to an Apache Superset application (see previous chapter) you will see the menu at the top, which includes Sources, Charts and Dashboards.
Here are some explanations of the concepts behind Apache Superset:
-
Datasource: A "source" can be created either by defining available tables and associated fields or by creating SQL queries and defining data sources from them.
-
Database: A connection to a database system that contains tables and views.
-
Chart, formerly called a slice: A chart is a list, chart, or web map. Superset currently knows 48 different charts, seven of which are interactive web charts ("map charts").
-
Dashboards: An interactive website that presents interactive charts.
-
Metrics: "Metrics" (sometimes also called "Measurements") are numerical indicators. They are mainly mentioned and required in the charts.
-
Records: Data sources and charts are all programming elements that are sometimes referred to as "records" in the user interface.
-
SQL Query: statement, database query in the SQL database language. SQL queries can be saved and made available to others as a data source.
| In the menu "Sources" of Apache Superset and in the original documentation of Apache Superset Druid is mentioned as database system. All information related to Druid in the menu (and documentation) can be ignored. |
Data and questions
The data to be visualized with Apache Superset (and Business Intelligence Tools in general) must be available in a structured and clean form. If necessary, the data must be prepared with database systems (SQL), spreadsheet programs (e.g. MS Excel, LibreOffice) or GIS (e.g. QGIS). (see e.g. OpenSchoolMaps > "Introduction to QGIS 3 and Geoinformation Systems (GIS)"). Helpful to clean up data ("Data Wrangling") can also be e.g. OpenRefine.
The data for this worksheet comes from the World Bank (Quelle, license CC BY-4.0, status approx. 2017). The data describes the population, urban/rural (habitat) and life expectancy per country or region over the years 1960 to 2014.
In this worksheet only one spreadsheet is used, the table wb_health_population (translated as "World Bank Health Population").
The table wb_health_population has about 328 columns (attributes), i.e. many.
We use the following columns:
-
Name of the country:
country_name -
World region in which the country is located:
region -
Year of data collection (1960 - 2014):
year. -
Total number of people:
SP_POP_TOTL -
Number of people living in the city:
SP_URB_TOTL. -
Percentage of people living in rural areas:
SP_RUR_TOTL_ZS. -
Life expectancy:
SP_DYN_LE00_IN
Figure 1 shows the data we will use. Take a moment to take a closer look at these data. Understanding which data is in which column is a necessity in order to create meaningful and correct diagrams.
We now want to analyze these data and ask ourselves whether characteristics or correlations can be identified, for example: "Do more people live in a country in the countryside (rural) or in a city (urban)?", or "Is there a relationship between life expectancy and rural or urban regions?
Seven charts (diagrams)
At the end of this tutorial you will have created seven charts (and a filter).
First look at the attachment to see what Apache Superset has to offer for charts, where we have only made a selection of the over 40 charts Superset has to offer at the moment.
The charts that will be used in this worksheet are numbered in Figure 1 in the order in which you will create them.
-
At the top left is a filter (number 8). This allows you to restrict the datasets to one region or country.
-
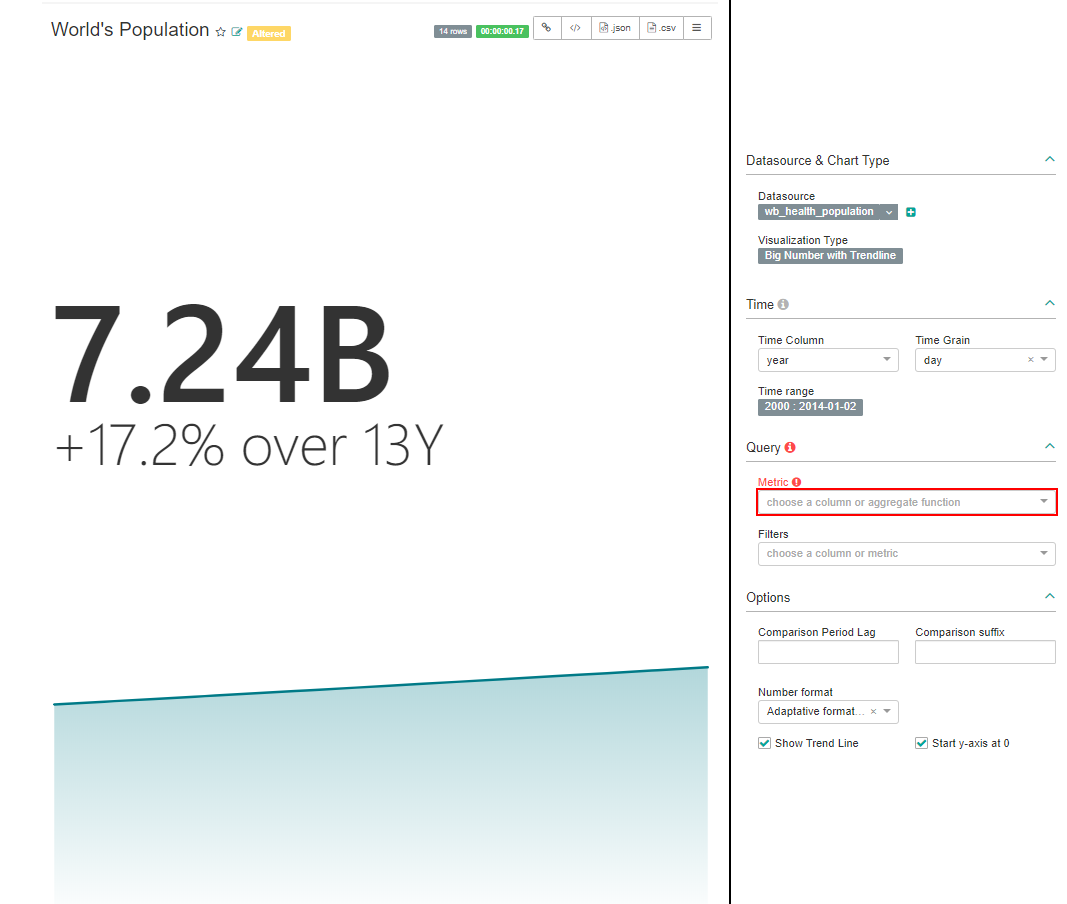
Directly below is Chart No. 3, called "World’s Population". This shows the size of the population and its growth by means of a line.
-
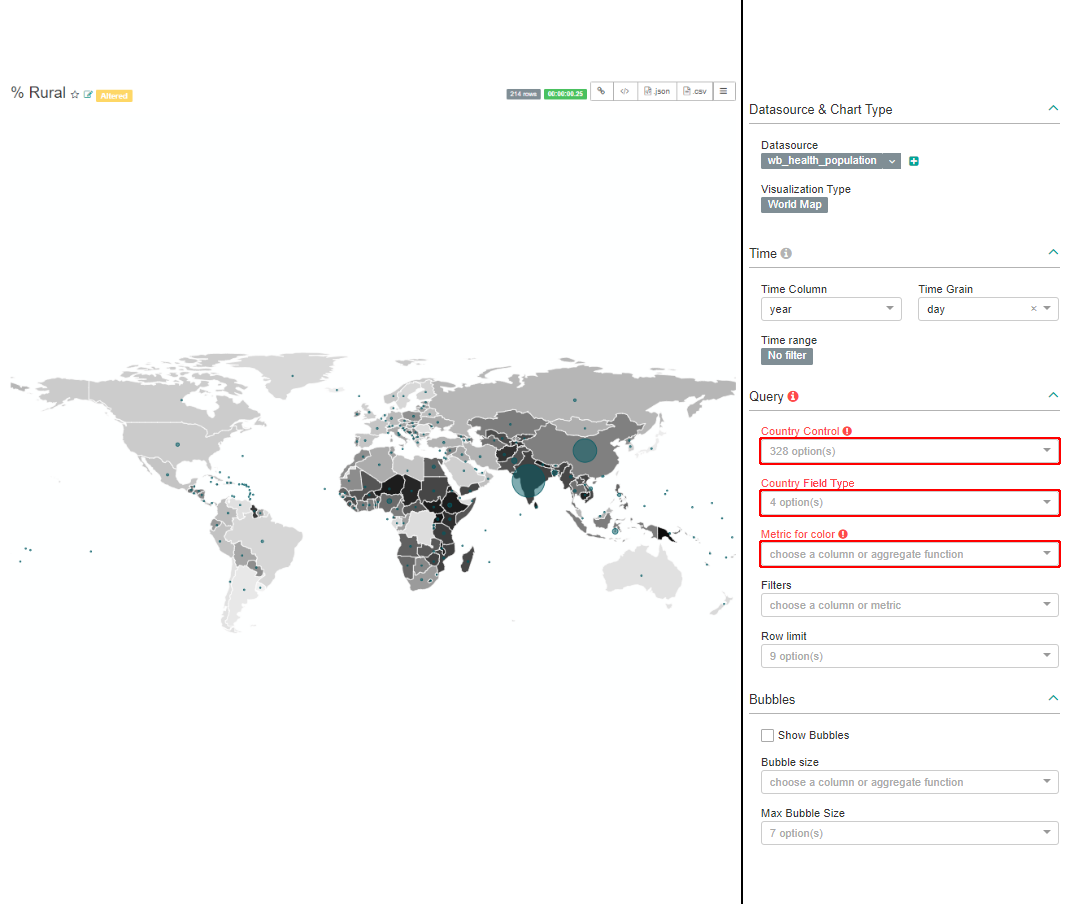
To the right of these two charts is a world map ("% Rural"). This chart no. 7 shows how many people live in rural areas (black = 100% / white = 0%) by coloring the countries. In addition, a bubble indicates how many people there are as a number.
-
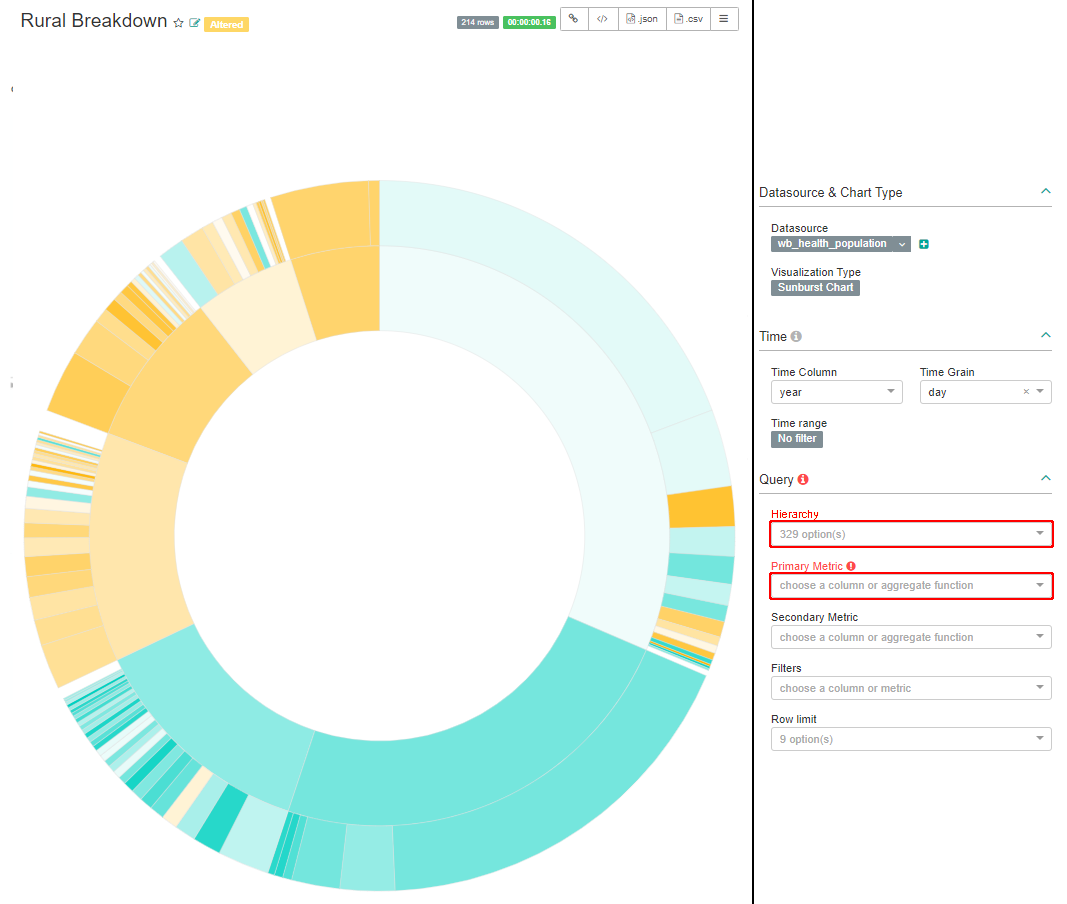
The chart no. 2 "Rural Breakdown" below shows the same data. The inner circle shows the region and the outer circle the country (when hovering over the sections with the mouse, this information is displayed).
-
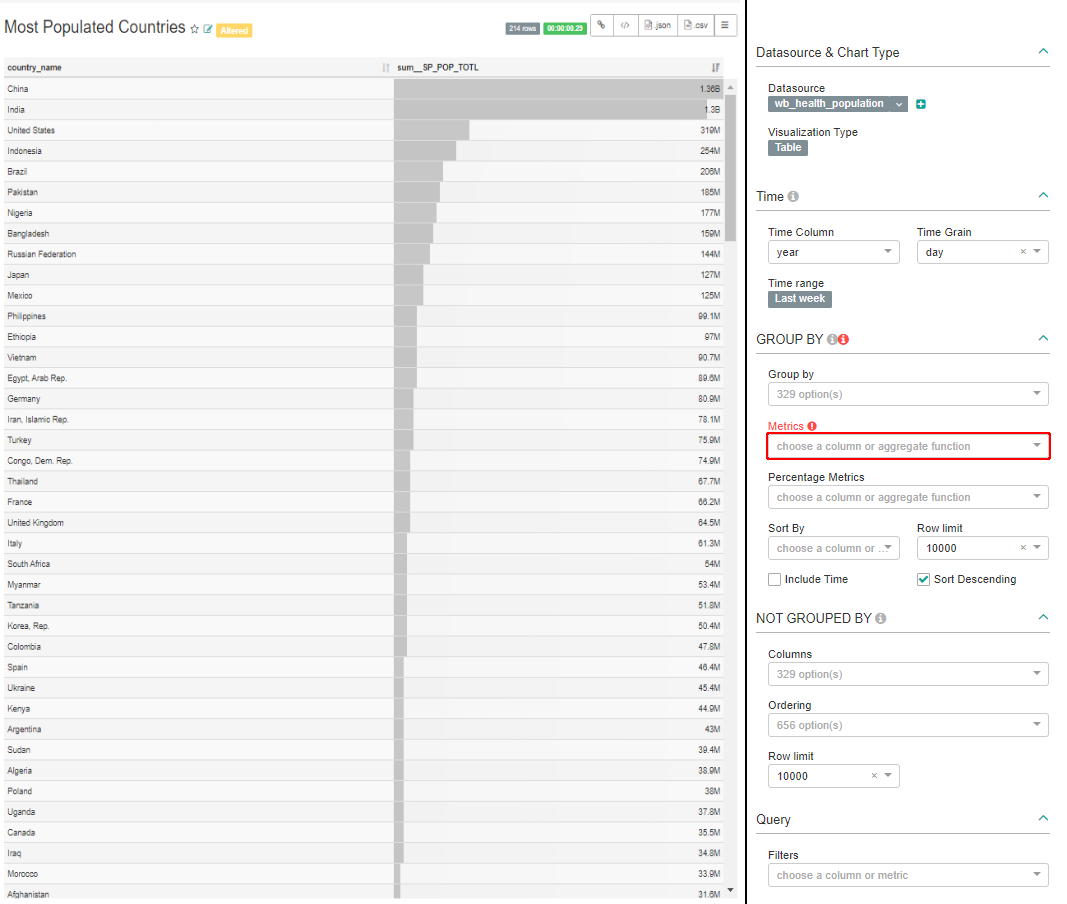
On the right side there is a table (Chart no. 1) and this shows each country and the size of its population (Metric).
-
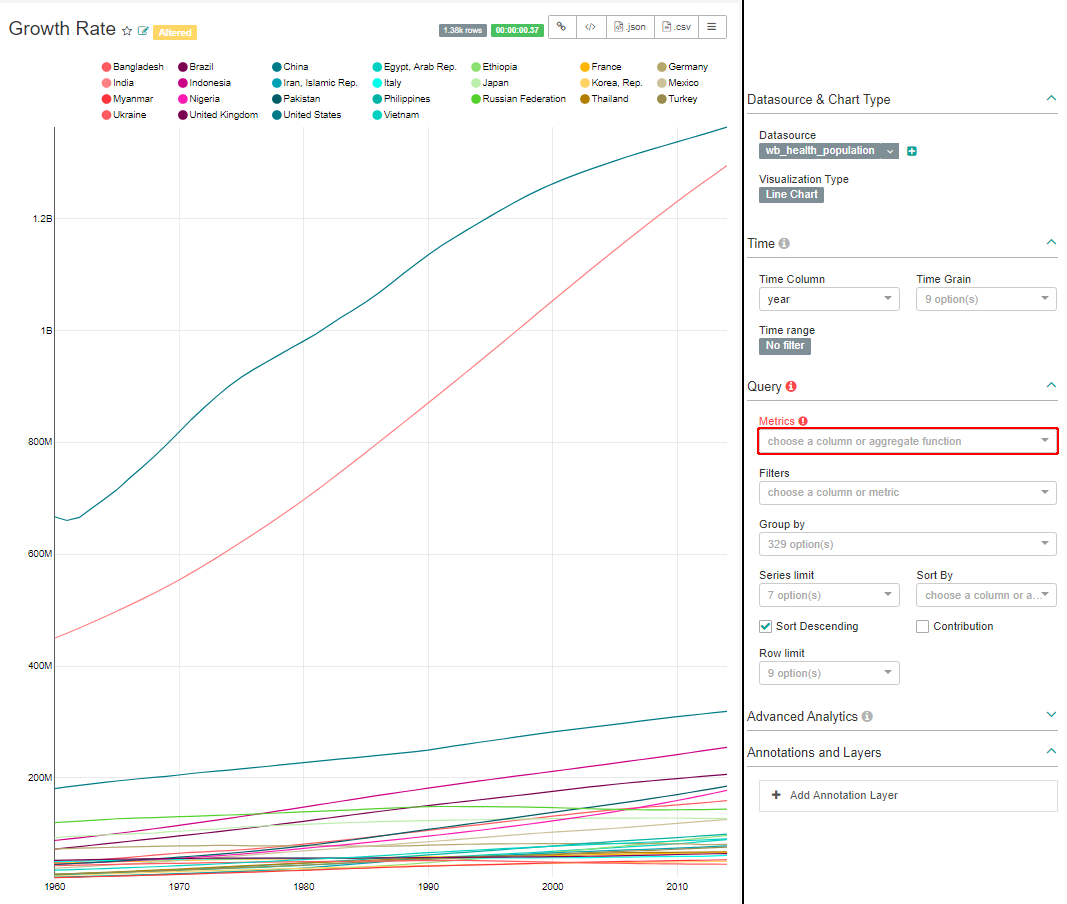
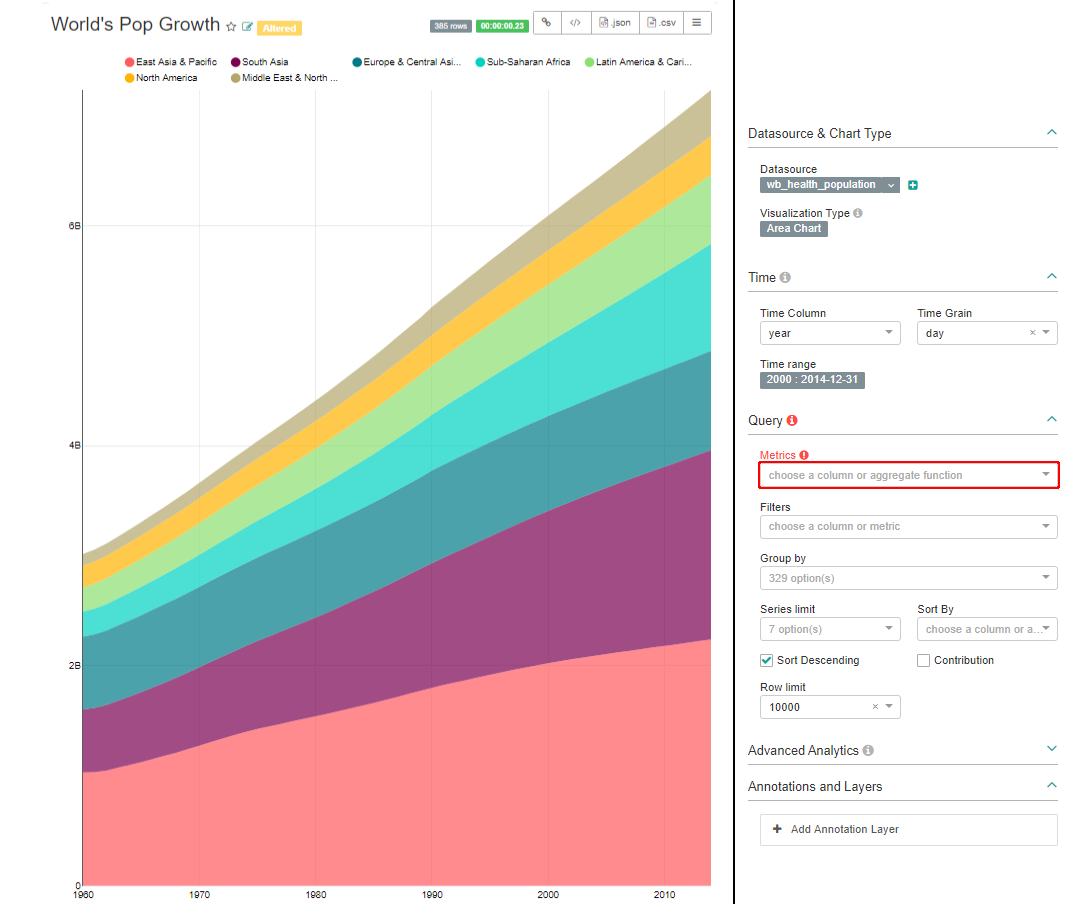
The line chart "Growth Rate" (Chart No. 4) also shows the growth of the population, but over a longer period of time than in "World’s Population". And it also shows it per country. "World’s Pop Growth" (Chart No. 5) visualizes the same data as Growth Rate, but is divided into regions.
-
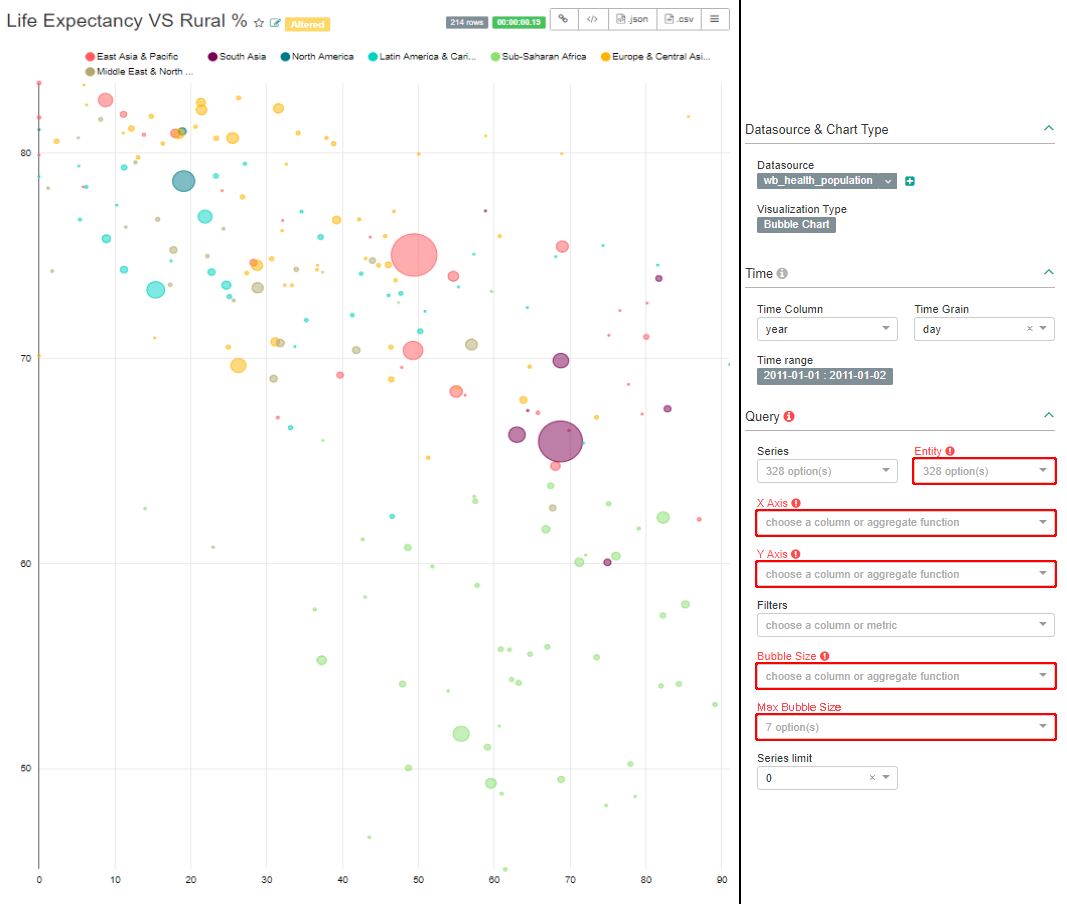
Finally, there is a somewhat more complex Chart No. 6 "Life Expectancy vs. rural %", which shows how high life expectancy is in a country, in which region it is located and what percentage of the population lives in rural areas.
My first chart
First you have to choose a data source.
Under you can see the different tables.
Here you can click on the magnifying glass
to get more detailed information about the table,
such as which columns the table has and which data types can be stored there. In addition, you can set under Columns whether you can group by this column, whether it is temporal or filterable.
To query a table, click on the name of the table.
In this example the wb_health_population is used.
You can only select one table as source.
If you want to link several tables to one data source, you need SQL knowledge (see other worksheets).
Selecting a table will open a new window respectively a new browser tab where you can create a chart.
There you will find the selected table wb_health_population as Datasource.
Directly below, in Visualization Type (Chart-Type) you will find Table, which is a simple bar chart.
First you have to adjust the time span under Time, because the data of the table wb_health_population starts in 1960 and ends in 2014.
We therefore use a custom filter of 2014-01-01 - 2014-12-31.
To get all data - no matter to which year they belong - or if there is no data that is time-dependent, you can choose No filter.
|
For example, to select the year 2014, you can also type 2013 to 2014.
|
Under GROUP BY you can now define your first query by selecting a column like SP_POP_TOTL (Population Total) at Metrics and taking the sum of the columns.
The Metrics column must always be used.
It is also used on all representations to determine how much weight this row has (for a circle chart this would be the size of the section).
If you now press Run Query, the query will be executed.
It shows on one line the world population, i.e. how many people lived in 2014.
Under GROUP BY → Group by you can further subdivide the query.
Group by is used to get from a total to an amount per selected attribute, e.g. the population per country.
Therefore select the attribute country_name here (the preceding "ABC" shows the data type of this attribute, which is not important at this point).
Now save this chart as your first result in Apache Superset, e.g. with the name "Chart 1". You will need this chart again later.
![]() Task 2
Task 2
Now that you see the population of each country, we can limit the data to all countries with more than 100 million inhabitants. Try to do this using the filter under Query (you don’t need the _Custom SQL option for this)._
Chart No. 2 Urban distribution
To make the whole thing even more beautiful, you can choose a suitable chart for the data under Datasource & Chart Type → Visualization Type.
![]() Task 3
Task 3
Take the result of task 2 and present it as a sunburst chart (Hierarchy is similar to Group by in Table View).
Now add region at the top of Hierarchy.
The order is important for the display, so that you can see in which region
the country and how much of its population it makes up.
At this point it is advisable to remove or adjust the previously created filter so that you have more examples where you can see the consequences of the next step.
| Each chart has its own options. |
Next, we’ll adjust the color, because the graphic isn’t very pretty at the moment. The color of this chart can be adjusted in two ways:
-
click on the Customize tab and select a new color scheme.
-
use the color to display more information. You can do this by selecting Secondary Metric →
SP_URB_TOTL(Urban Total) and adding it up. This means that you can now see immediately how the majority of the population lives in the country (in the city or in the country).
Now save your chart under a suitable name. You will need it again later.
Chart No. 3 Population growth
Next, it would be interesting to see population growth.
You can see the growth in Superset with the Big Number with Trendline Chart as a trend line, whereby this also shows the last value above the trend line. The chart would already be usable, but you can also set Options → Comparison Period Lag and Comparison suffix.
Comparison Period Lag_ specifies which years are compared to show the percentage growth. (If you type a five in Comparison Period Lag, it compares the last year he has (in this case 2014) with the one five years before it (2009)).
At Comparison suffix you can enter a text describing the percentage. The descriptive text is displayed directly after the percentage.
![]() Task 4
Task 4
Represents the population growth from 2000 to 2014 using the Big Number with Trendline.
Now save your chart under a suitable name. You will need it again later.
Chart No. 4 Population growth per country
Since Chart No. 3 only shows us the average growth, it would be interesting to see the population growth per country to get a better insight into the distribution.
![]() Task 5
Task 5
Now, since you have already depicted the growth of the population, it should not be difficult for you to visualize the growth rate per country using a line chart. Set a series limit to limit the number of countries displayed and increase the time span to 1960-2014. You can type in the time span or set the filter to No filter.
Save this chart as well.
Chart No. 5 Population growth per region
![]() Task 6
Task 6
Another way to display this data would be with an Area Chart. Try it out!
Chart no. 4 has already split the data very heavily, let’s adjust the chart so that the split is less strong to get a better overview.
Before you also save this chart again, let it show you the growth of the individual regions. In the attachment you will find a picture (figure no. 10) of the chart. However, the colors may differ.
Chart No. 6 Life expectancy vs. percentage of rural population per country
Next, we want to try something more difficult, namely create a 6th chart as follows:
In this chart you can see how many inhabitants live in rural areas (X-axis), how high the life expectancy is (Y-axis), in which region a country is located (color of the bubbles) and how high the population is (size of the bubble).
This chart illustrates very well if and how life expectancy is related to the percentage of rural living.
To get this chart, first select the Bubble Chart and set the time span from 2011-01-01 to 2011-12-31.
Then you have to select region under Series to color the bubbles accordingly.
At Entity you have to choose country_name to show the countries.
![]() Task 7
Task 7
Select the correct columns for X Axis, Y Axis and Bubble size.
Also save this chart under a suitable name.
Chart No. 7 World Map
To finish, we will create this Chart No. 7, a Map Chart:
This map chart shows how many people live in rural areas by coloring the countries (black = 100% / white = 0%). In addition, a bubble indicates how many people there are. To see the percentage of the rural population or the size of the population, you have to hover with the mouse over the country or the bubble.
It’s a World Map. Here are the corresponding options:
-
You have to change the time span again to
2014-01-01to2014-12-31. -
Under Country Control you will have to select the
Country_codeand under Country Field Type thecode ISO 3166-1 alpha-3 (cca3). The Country Control is used to define in which country something is located by an abbreviation and Country Field Type interprets this abbreviation. -
Under Metric for color you can select
SP_RUR_TOTL_ZSto make the color dependent on the percentage of people living in the country. -
You can also choose Bubble size
SP_RUR_TOTLto create a bubble for each country, indicating how many people live in the country.
Remember to also save this chart under an appropriate name.
filter box for the dashboard
Now that we have some charts, a filter that you can apply to all charts in the dashboard would be handy.
All you have to do is select the Filter Box as Visualization Type and under Filters select the appropriate columns e.g. region and country_name.
You can also deselect the Date Filter option.
Of course you have to save this filter to be able to use it later.
Arrange Charts to a Dashboard
Under you can now create your own dashboard where all your charts can be displayed.
When creating a dashboard, you can make some settings, but often it’s enough to just fill in the Title field.
At the moment your dashboard is empty, but you can simply fill it by drag & drop (you have to drag the first component up to the border). If a component can be placed, this will be indicated by a blue line showing how/where the component is placed. First, click the Edit dashboard button to see all the components you can add.
-
Tabs are the same as the tabs in the browser itself and can contain anything.
-
Rows and Columns can be used to connect individual components. If components are connected, you can also turn the space between them white. By hovering over the connected components, a button will appear showing this option.
-
To divide the connected components into groups you can use Divider. These represent a dash.
-
Header can be used to give a heading to the components and Markdown can be used to write a descriptive text for a chart.
-
Under Your charts & filters you can find all charts you have created so far.
After adding a component you can resize it. By clicking on the lower right corner the desired size can be adjusted.
![]() Task 8
Task 8
Create a dashboard using all previously created charts and filters. It is best to try out the different components!
share dashboards with others (over the web)
As soon as you are satisfied with your dashboard, you can publish it. This is done by clicking the drop-down menu behind the Edit dashboard button and then clicking Share dashboard. You can now send the link to another person, but that person (i.e. their role) must also have access to the data, otherwise only an error will be displayed.
completion
You did it! You should now have a dashboard containing the World Bank data that you can show others.
| Tip for the filter: In a time filter under Custom it is possible to write years directly. The date is then automatically the first of January. |
If you want to learn more about Apache Superset, we recommend the information sheet "Apache Superset for advanced users" on OpenSchoolMaps.
| There are also courses about Apache Superset at Geometa Lab HSR. |
We are happy to receive feedback, see OpenSchoolMaps > Other teaching ideas.
ATTACHMENT: The seven charts and options
Here you can see seven charts and their choices. A red border indicates which options are needed to create such a chart.
![]() Freely usable under CC0 1.0: http://creativecommons.org/publicdomain/zero/1.0/
Freely usable under CC0 1.0: http://creativecommons.org/publicdomain/zero/1.0/