Overview
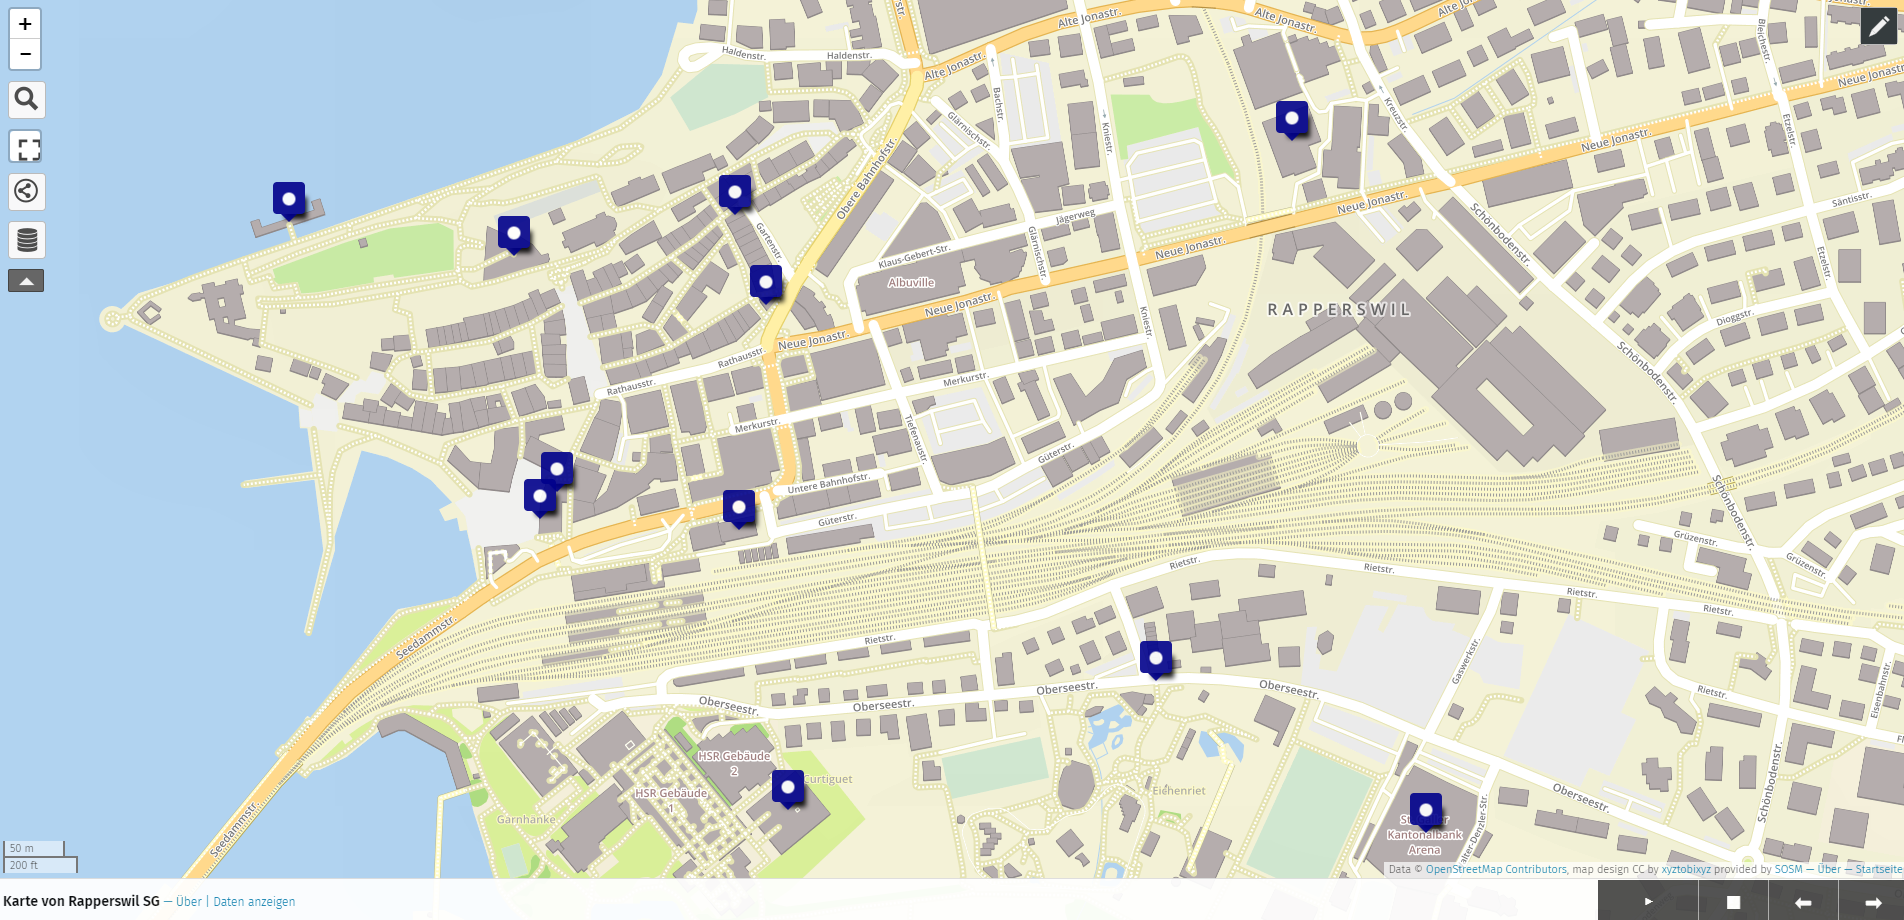
The goal of this guide is to create a story map with uMap as part of the OpenSchoolMaps project. In geography, a story map provides an attractive and informative combination of publicly available maps, accompanying text, images and multimedia content. This is the map we will create:

You can see the full example map at https://umap.osm.ch/de/map/karte-von-rapperswil-sg_1377#15/47.2188/8.8119. You may have to zoom in on the blue pins.
Anyone who is interested in "Mapping".
Depending on the size of your story map you should plan about 45 minutes for this guide.
Preparation
First you need a web browser in which you can open the page. Consider in advance what the end product should look like and note which points you want to have in it. This step is optional, of course, but very useful to make faster progress later.
Creating the Story Map
-
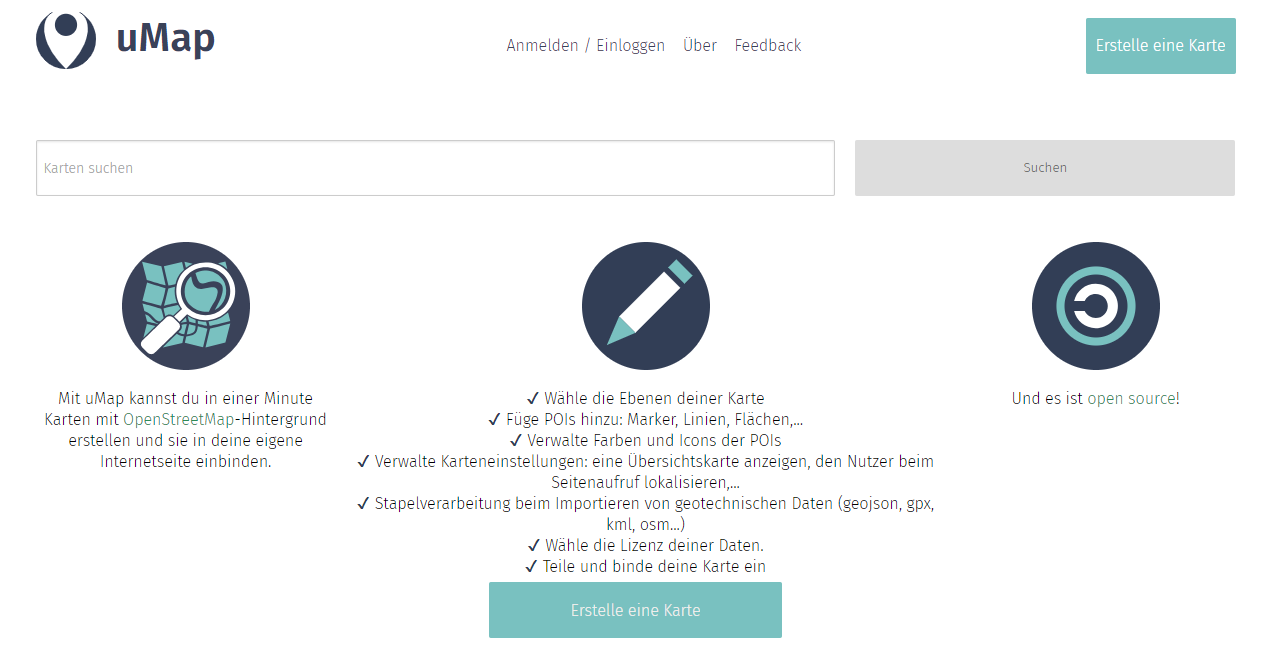
Visit the page umap.osm.ch.
-
Create a new map
 Figure 2. The umap.osm.ch homepage
 -
You can select the draw a marker icon
you would like to have on the map. You can also select the draw a polyline icon
or draw a polygon icon
.
-
Now to the actual "story". The most important step is to activate the slide show under "Edit map settings
 Slideshow → Toggle the Activate slideshow mode". After saving the settings, you probably need to refresh with F5.
Add Description
Now that you have added several points to the map, we can add a description for each point. These descriptions are displayed during the slide show.
To add a description, click (in edit mode) on the item you want to edit and write your text in the "Description" text box. In addition, write a suitable name for the point in the "Name" text box, as we will need it later.
|
To create a nice description we have some tips for you:
Further display modes can be found by clicking on the question mark above the "Description" text box. |
To add an image to the description, you first need the link to the image.
If the link is https://www.example.com/picture.png, then you must enter the following: {{https://www.example.com/picture.png}}
Your description should now look something like this:
Now add a description to each item. If you are satisfied with the result, you can click on the "Save" button at the top right and exit the editing mode.
By clicking on the play button you can start the slide show and view its story map. Clicking the Stop button allows you to stop the slideshow.
Change display (optional)
-
You can change the appearance of pins under "Edit map settings
 → Default shape properties → Icon symbol".
 -
You can also display the pop-up information in the sidebar. To do this, go to "Edit map settings
 → Default interaction options → Popup style" and select "Side panel". After saving and refreshing the site, the pop-up information should appear in the side panel.
Controlling the order of the slideshow (Advanced)
To control the order of the locations in the slideshow, we need to add a sort key. Open the layer management ![]() on left side of the screen and click on the tiny icon "Edit properties in a table"
on left side of the screen and click on the tiny icon "Edit properties in a table" ![]() Click on the button
Click on the button ![]() and enter a name (for example "index"). Now you can enter a value for each location in the "index" column with which the website can sort the order. Since the table in uMap sorts lexographically, for example, the number 20 will appear before the number 3. To prevent this, you should use values such as 1000 and above to sort. If you have added a sort key for each location, you must then select the newly created sort key column under Edit map settings
and enter a name (for example "index"). Now you can enter a value for each location in the "index" column with which the website can sort the order. Since the table in uMap sorts lexographically, for example, the number 20 will appear before the number 3. To prevent this, you should use values such as 1000 and above to sort. If you have added a sort key for each location, you must then select the newly created sort key column under Edit map settings ![]() → Default properties → Sort key. (No selection is made here - you must enter the name of the field yourself!)
→ Default properties → Sort key. (No selection is made here - you must enter the name of the field yourself!)
Add Features (Advanced)
So far we have always written the whole description ourselves. In order to simplify this process, we may store this information with characteristics.
As you learned in the previous step "Controlling the order of the slideshow", you must also add new features to the table here. Two more columns that you will certainly need are "bildurl" and "text". We have added another column "opening hours" in the example. However, this is optional and of course you can add other columns if you wish.
Fill the newly created columns with values and close the sidebar again. The result should look something like this:
To use these values from the table, you must insert this text under "Edit map settings ![]() → Default interaction options → Popup content template":
→ Default interaction options → Popup content template":
{text}
{{{bildurl}}}
{opening hours}
| If you do not have any column "opening times" or have generally used other column names, you must change or remove these accordingly. |
From now on you only have to add the information in the table for the new points on the map and afterwards the display text for the popup is compiled automatically.
| When creating a uMap, the data in OpenStreetMap is not changed, only "drawn on". |
uMap and the OpenSchoolMaps project are based on OpenStreetMap (https://osm.org).
Any more questions? Please contact Stefan Keller (stefan.keller@ost.ch)!
![]() Freely usable under CC0 1.0: http://creativecommons.org/publicdomain/zero/1.0/
Freely usable under CC0 1.0: http://creativecommons.org/publicdomain/zero/1.0/