A worksheet
Overview
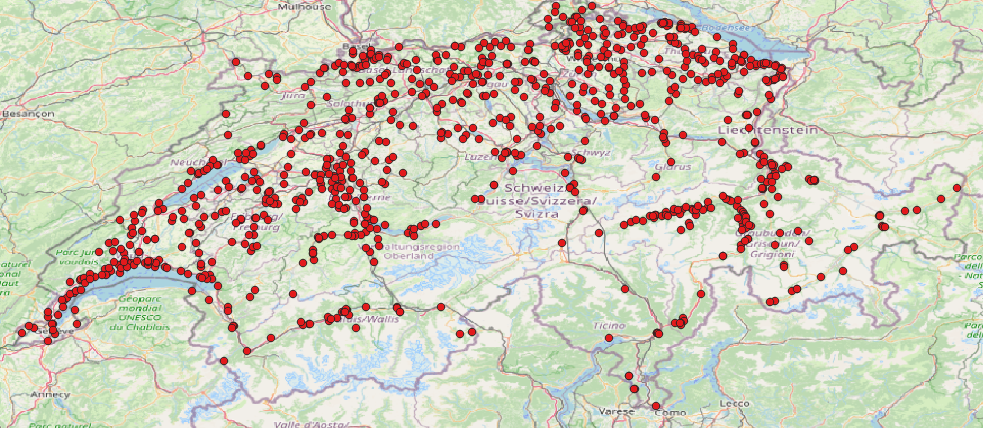
This worksheet explains how to use certain point rendering techniques can be used to represent large amounts of points. We will use various so-called "point renderer" functions of QGIS to show how such challenges can be overcome.
This exercise uses data from Swiss castles (archaeological sites, fortifications, towers, etc.). The exercise will explain and demonstrate some of the key QGIS point rendering techniques:
-
Point cluster renderer
-
Point displacement renderer
-
Heat maps
Learning goals
After completing this worksheet, you can:
-
understand the challenges of data collections and how to overcome them,
-
Use the most important point representation techniques efficiently with QGIS,
-
Understand which point rendering techniques solve which problems.
Introduction
Most objects in the real world can be represented as dots, but they can pose many challenges. These different challenges can be overcome with certain techniques and renderers. In this worksheet we will describe and explain some of the most important QGIS renderers. We have taken some historical places in Switzerland as special examples, i.e. in detail: castles, towers, archaeological places, fortresses etc. These are fine examples to demonstrate what points are and what rendering techniques can be used to solve the problems they can pose.
QGIS offers some useful point rendering techniques. Such techniques are mainly used to deal with limited space on the screen and to distinguish between different points in a narrow space. They can also be used to distinguish in-demand areas from less-in-demand areas.
Preparation
In order to understand and solve this worksheet, you will need to do the following:
-
Software: QGIS Desktop (tested with QGIS 3.10.1-A Coruña)
-
Data:
castles.geojsonfile
After you have done that, we will load the necessary data into the QGIS and start explaining.
Data preparation
The geospatial data used for this worksheet is in the .geojson format.
They are from Overpass-Turbo (overpass-turbo.osm.ch), a simple downloadable web app of OSM data in various formats.
The data is taken directly from OpenStreetMap, including the attributes (tags).
QGIS can read .geojson files and process them in the map.
To view the overpass query of the OSM data in the .geojson file,
you can use the following link: https://osm.li/3FH
|
A .geojson file looks like this:
  "timestamp": "66536",
  "features": [
    {
      "type": "Feature",
      "properties": {
        "@id": "relation/1167735",
        "building": "yes",
        "castle_type": "defensive",
        "historic": "castle",
        "historic:civilization": "medieval",
        "name": "Château d'Yverdon",
        "type": "multipolygon",
        "website": "https://www.yverdonlesbainsregion.ch/de/P944/schloss-von-yverdon-les-bains",
        "wikidata": "Q683081",
        "wikipedia": "de:Schloss Yverdon",
        "@geometry": "center"
      },
      "geometry": {
        "type": "Point",
        "coordinates": [
          6.6414958,
          46.7782205
        ]
      },
      "id": "relation/1167735"
    },
    {
      "type": "Feature",
      "properties": {
        "@id": "relation/1169711",
        "access": "permit",
You can find more information about the file extension .geojson
here: https://geojson.org/
|
Set up the enviroment
To set up the environment and QGIS you have to do the following:
-
Open QGIS and make sure that no existing project is open.
-
Load the file
castles.geojson(or export it manually with Overpass Turbo: https://osm.li/3FH) with drag & drop in QGIS. -
Choose a map background so that we can see where the points are on the world map.
Now you are ready to go!
Point cluster rendering
One of the most important point display techniques is point cluster rendering. This technique replaces closely related points with a single symbol. This reliefs the map image, as the symbol saves space.
Select the Point-Cluster-Rendering for the layer with the style menu. Now you can play around with the Distance parameter in the options and see what difference it makes.
The parameter that determines how close the points should be in order to be converted to a cluster can be adjusted.
Here you can see castles and palaces in Switzerland as an example after using the point cluster rendering technique.
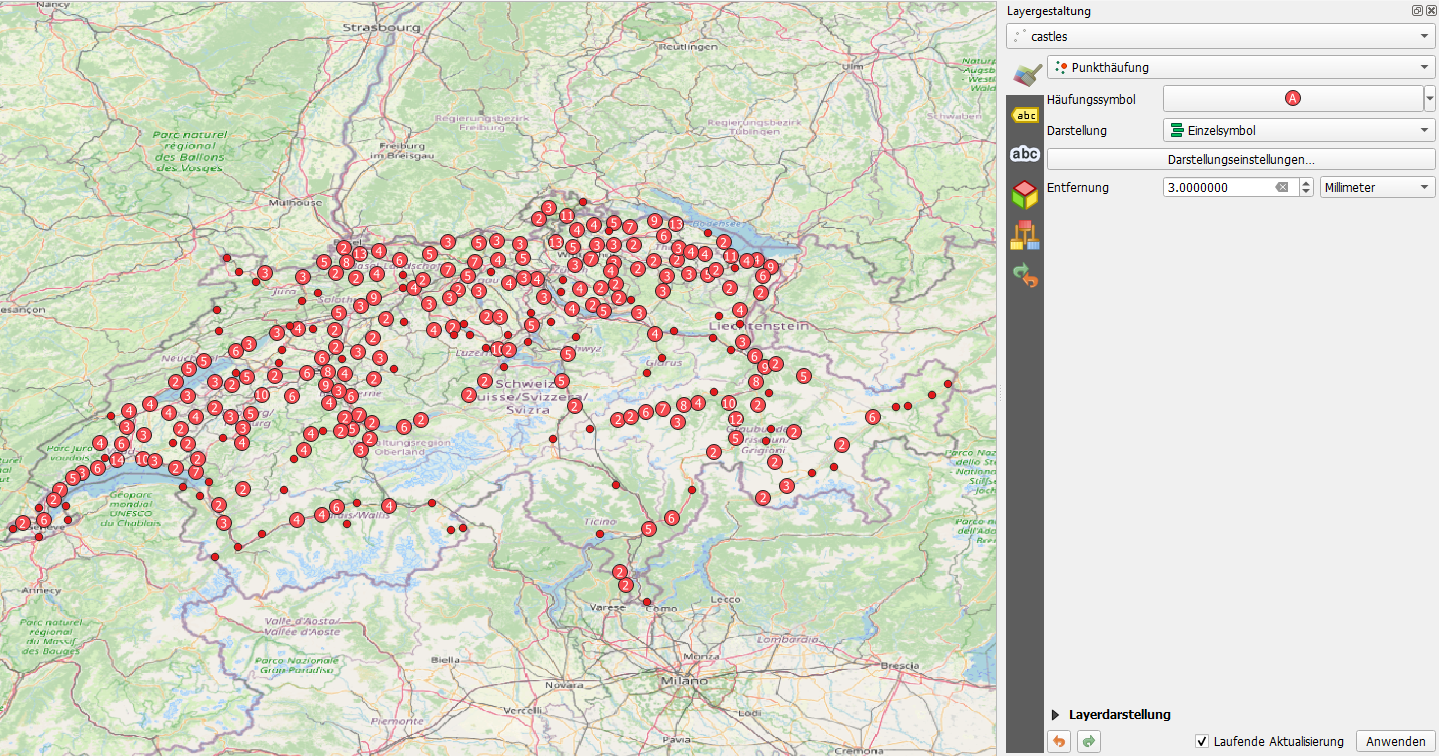
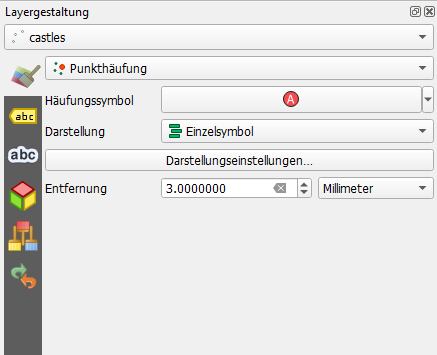
QGIS also gives us some options for this rendering technique. This allows us to make the following changes:
-
Cluster symbol
-
Distance to trigger the cluster
-
Renderer type etc.
Point displacement rendering
Another important point rendering technique is called the point displacement renderer.
Suppose we have many points within a map layer. When we zoom out, many points come to rest on top of each other, they overlap. This means that they can no longer be specifically selected, for example. This is when we apply the point displacement technique.
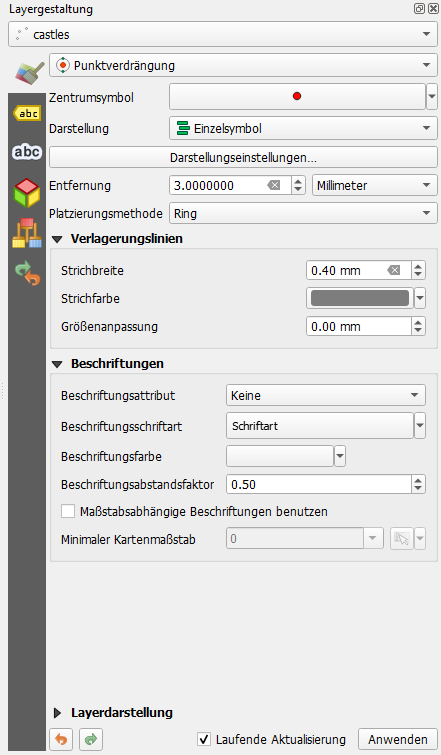
With this rendering technique, overlapping points are grouped in the map view and given a 'center symbol'. When clicking on it, symbols are placed in a circle around the center point.
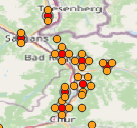
The point displacement renderer also gives us a few options. With these we can do the following:
-
Center symbol shape / color
-
Define renderer mode for the points
-
Specify the distance to move the overlapping points
-
Choose placement method
-
Select the line shape and color of the shift
-
Change lettering, etc.
Heat map
Another important rendering technique is the representation of points as a heat map. This technique is a popular visualization for dense point data.
A heat map rendering technique is useful for quickly identifying groups of points with high density (proximity). This can be useful for some scenarios, such as locating dangerous areas (offenses / crimes), traffic accidents, housing density, etc.
We will use the same geospatial data as before to demonstrate the heat map (castles and palaces in Switzerland).
Now select this option for the layer and play around with the Radius parameter in the rendering options to see the differences.
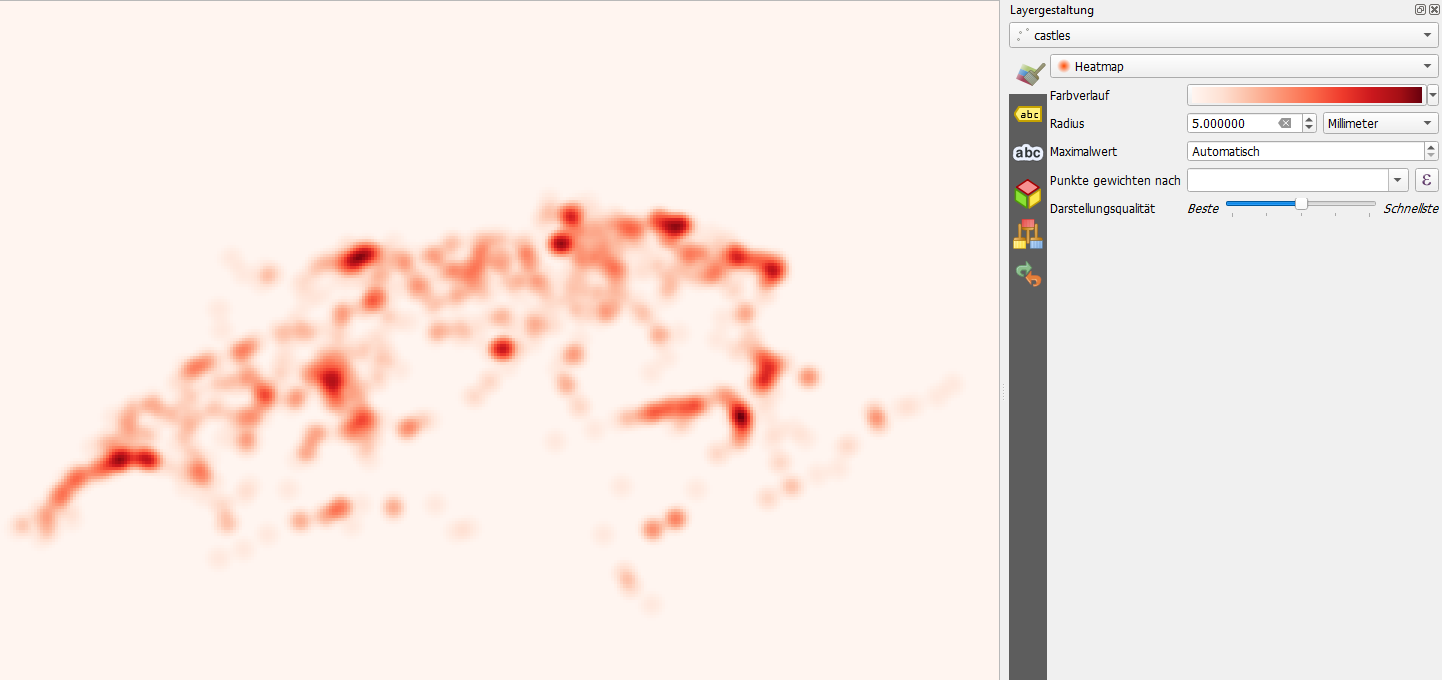
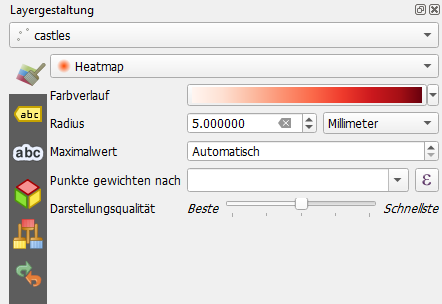
After generating the heat map, some options will be displayed in QGIS. These options allow us to set:
-
Color of the heatmap and the background
-
Quality of the heat map display
-
Maximum value
-
How to weigh points, etc.
Exercises
In the practice section, we will use other geospatial data to give you a better understanding of how points work and how the rendering techniques can help solve some point problems: We will use table tennis data from Switzerland.
Preparation: Requirements before starting the exercises
-
Create a new, empty QGIS project.
-
Load the file
table_tennis.geojson(or export it manually with Overpass Turbo: https://osm.li/5XH) using the drag & drop technique in QGIS. -
Choose a map background so we can see where the points are on the world map.
Exercise
Play around with all of the point rendering techniques mentioned in the main part of the worksheet and answer the following questions:
-
Find clusters of table tennis tables in Switzerland.
-
Create a heat map to find the hotspots of table tennis tables in Switzerland.
-
Find out which city in Switzerland has the most table tennis tables.
Conclusion
With this worksheet you have learned how points are visualized on the map and how we can use different point rendering techniques to solve certain problems that points can pose.
Each of the point rendering techniques solves a specific problem. There is no one point rendering technique that can solve all issues. This means that you have to weigh up which technology is the most suitable.
Outlook
Some other records
Here are some other data sets that can be used to show how points and also the different QGIS point rendering techniques work:
-
Football pitches in Switzerland: https://osm.li/BYH
-
Basketball courts in Switzerland: https://osm.li/CYH
-
Night clubs in Switzerland: https://osm.li/DYH
-
Tourist attractions in Switzerland: https://osm.li/GYH
All of the above data sets can also be exported to .geojson files,
by clicking the Export button in Overpass Turbo.
They can then be loaded into QGIS using drag & drop.
|
Any more questions? Please contact Stefan Keller (stefan.keller@ost.ch)!
![]() Freely usable under CC0 1.0: http://creativecommons.org/publicdomain/zero/1.0/
Freely usable under CC0 1.0: http://creativecommons.org/publicdomain/zero/1.0/