An information sheet for interested individuals.
Overview
This fact sheet refers to the release 0.34 of Apache Superset, which was released in September 2019. It contains the following topics:
-
Documentation and Feedback
-
Upload data (tables in CSV format)
-
Create a chart
-
Create, edit and publish a dashboard
-
Link one table to another and use the SQL database language.
-
Data types, data type roles, and data type encodings
-
The visualization process and the Superset maps charts
-
customize charts and dashboards, including tooltips and annotations
In the attachment all map charts with all necessary parameters are compiled again.
See also the worksheet "Introduction to Apache Superset".
| Apache Superset is designed for data visualizations that require significant resources on both the server and client sides. Superset is therefore primarily aimed at web browsers on the desktop or on tablets and can only be used to a limited extent on mobile devices with small screens. |
Documentation and Feedback
A documentation for users of Apache Superset seems to be in the making. Documentation for software developers will be available in early 2020. The official documentation (English) contains a small FAQ, but is still thin and not updated (charts are called slices, for example).
If you have questions, we recommend to ask them at Stackoverflow (always together with the tag 'apache-superset').
We are happy to receive feedback (see OpenSchoolMaps > Contact).
Upload of data (tables in CSV format)
This chapter describes how to import data from your computer into Apache Superset. Superset allows you to upload files as CSV (Comma Separated Values).
As an example we take the data of the "CIA World Factbook" for the upload. The corresponding data is called "Apache Superset Data (CSV)" at OpenSchoolMaps and can be downloaded and unpacked there under Teaching Materials and "Additional Materials".
The CSV files cia_world_factbook_2019.csv and country_codes.csv should now be available on your computer.
First check the encoding and format of the file: the encoding must be UTF-8 and the format must be CSV.
| MS Excel usually manages files in .xlsx format. These can be exported as CSV UTF-8. The preferred delimiter for MS Excel is the semicolon. |
Upload CSV file:
-
In Superset, select Sources > Upload a CSV from the menu. The form "CSV to Database configuration" appears.
-
In the form "CSV to Database configuration" select the table name, e.g.
factbook_data(for simplicity it is recommended not to use capital letters in table names). Then select the CSV filecia_world_factbook_2019.csv, and if necessary select the desired target database, e.g.superset-extra-data(database must be prepared by the Superset administrator). -
If necessary, adjust the delimiter.
-
Under "Table Exists" select what Superset should do if a table with the same name already exists.
-
Click on "Save".
-
Repeat this upload if necessary, for example with the CSV file
country_codes.csv.
This will finish the upload and you can jump to the next chapter "Creating a Chart".
It is recommended, however, to check whether the correct data types have been selected for the corresponding attributes.
Check a table with its attributes and datatypes:
-
Select the Sources > Tables menu.
-
Search for the desired table (e.g. the table
factbook_data) and click on "Edit entry" (the middle of the three small buttons). The form "Edit Table" appears with tab "Detail". -
In the form "Edit Table" change to tab "Columns". A list of the columns (attributes) with their data types appears.
-
Click on "Edit entry" in the column definitions whose type is to be adapted.
-
Enter the desired data type in the "Type" field, here: Integer
INTEGERinstead of floating pointDOUBLE PRECISION. Data types are described in a separate chapter below. -
Click on "Save".
| The assignment and conversion of data types requires knowledge of the underlying data and know-how. If you are unsure about the possible data types, you can see below in the chapter "Data Types". |
This completes the upload of the files and you typically want to publish the data. This is done with a chart and a dashboard.
The next chapter explains how to create a chart.
Create a chart
A new chart is created from a table as follows:
-
Select the Sources > Tables menu.
-
Search the desired table (e.g. the previously uploaded table
factbook_data) and click on the name. -
A chart window appears with the name "- untitled" and the "Visualization Type" (Chart) "Table" (the default chart type).
-
Check if it has a number on the right side of the line "COUNT(*)". For table
factbook_datait is 261. -
Give the chart a name by clicking on "- untitled", e.g. "CIA World Factbook Table".
-
Click on Save in the top left corner. A dialog "Save A Chart" appears.
-
Give a name to the dialog "Save A Chart", here for example again "CIA World Factbook Table".
-
Click on "OK".
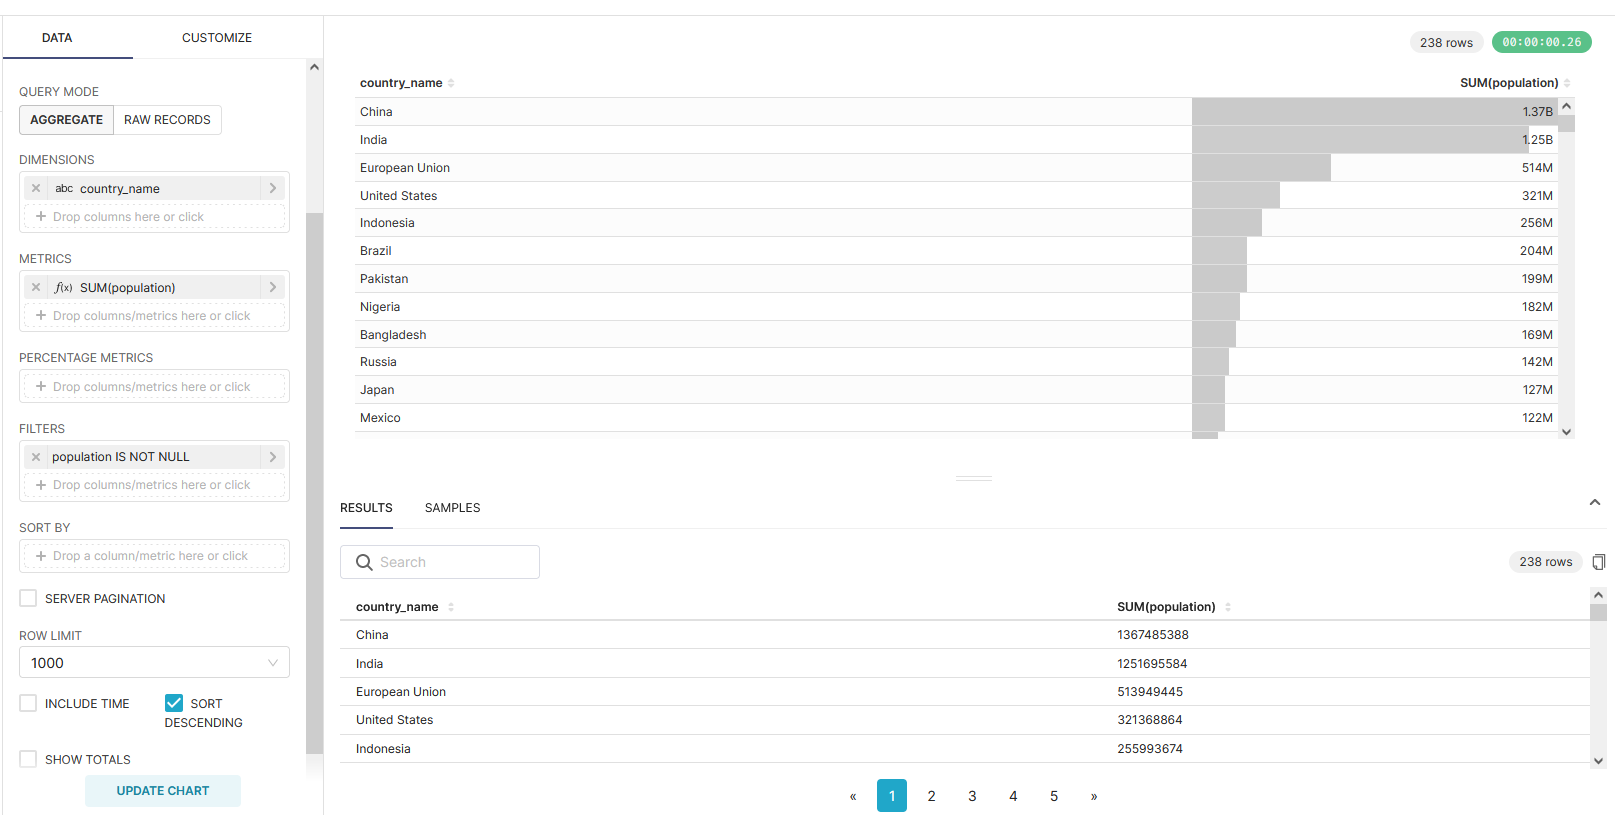
factbook_data as source.Create, edit and publish a dashboard
This chapter shows how to create, edit and publish a dashboard from a chart.
Creating a Dashboard
Once you have created a chart — for example the chart "CIA World Factbook Table" in the chapter "Uploading data" (see also the worksheet "Introduction to Apache Superset") — you typically want to add and publish the chart to a dashboard.
Create a new dashboard:
-
A new dashboard can be created either in the Dashboards menu using the "" button on the right or directly at the top right using the " New" > Dashboard button. The form "Add Dashboard" opens.
-
Enter a title in the form "Add Dashboard", e.g. "CIA World Factbook Test".
-
At the bottom of the form there is a checkmark for "Published". We’ll go into this later.
-
Click on the "Save" button to save the dashboard.
This creates the dashboard, but we still have to layout it and assign charts to it.
Edit a dashboard
This chapter shows how to edit a newly created dashboard (layout, i.e. positioning of charts).
Edit Dashboard:
-
Click on the Dashboards menu. A list of dashboards appears.
-
Click on the desired dashboard in the list, e.g. "CIA World Factbook Test". The dashboard opens in "View Mode".
-
Click on the "Edit dashboard" button in the upper right corner of the dashboard window. The dashboard is now in "Edit Mode" and the dialog "Insert components" appears on the right.
-
The dashboard can now be laid out. Changes are saved directly.
-
The button "Switch to view mode" in the upper right corner can be used to switch back to the normal dashboard view ("View Mode").
| The layout, i.e. the positioning of the charts, requires some practice. In the chapters below there are some hints how to customize charts and dashboards. And the worksheet "Introduction to Apache Superset" introduces a filter as a "special chart" with which users can filter data and interactively influence charts. |
Publishing a Dashboard
This chapter shows how to publish and share a dashboard.
Publishing a Dashboard:
-
Switch to the Dashboards menu. The Dashboards list appears.
-
Click on "Edit entry" in the list of dashboards for the one you want to publish. The "Edit Dashboard" form appears.
-
Enter the user (user role) in the "Owners" field.
-
Check the box "Published" at the bottom of the form.
-
Click on the "Save" button to save the dashboard.
Now your dashboard is published and can be made available to other users!
| If the user is able to see and open the published dashboard, but does not see any data in the charts, you should check the user role. It must be configured to read the underlying database (permission "datasource access on …" or "all_datasource_access"). This should already be set up by the Superset administrator. |
Link one table to another
This chapter shows how to link a table to another table.
This link adds additional attributes (fields, columns) of the other table(s) in the horizontal direction to the first table. The link is made with the database language SQL using a specific attribute of one table (an identifier, a primary key), which is linked to an attribute (a foreign key) of another table. In the background, the database system must typically execute a so-called JOIN.
Two tables can be linked with SQL in principle as follows, here given the fictitious tables mytable (as the own table) and othertable (as the other table) with PostgreSQL as the underlying database management system as in the Apache Superset Cloud):
SELECT *
FROM mytable
JOIN othertable ON mytable.id = othertable.id;
| When linking two tables, the attributes to be linked (i.e. primary and foreign keys) must have the same — or a compatible — data type. |
In the following chapter "Linking a table with another with Superset" there is a concrete example.
If the other table is in another database, it can currently only be made available by someone with database administrator rights and good database knowledge (see PostgreSQL "Foreign Data Wrappers").
Link one table to another with Superset
The documentation mentions that you can select only one data source (table) to create a chart. However, thanks to the SQL database language, it is possible to query two or more tables. For this purpose, the SQL Editor can be used to create a so-called "view", which then appears in the table list as an additional table.
Below is an example:
For this we need the tables factbook_data and country_codes:
factbook_data contains for each country key figures like population and area (in km2).
You must first download the two tables as files country_codes.csv and cia_world_factbook_2019.csv:
see "Apache Superset Data (CSV)" OpenSchoolMaps.ch > Teaching Materials under "Additional Materials".
The downloaded file is a zip file, which you first copy into your own directory and unzip there.
Now the two files are ready to be uploaded to Superset.
Uploading CSV files is described in the chapter "Uploading data".
Suppose we want to show the population density of all countries as a map.
The population density of a country is the population related to the area of that country.
We link the table country_codes with the table factbook_data via the country_name, which identifies the country in both cases:
-
Open the SQL Editor dialog from the SQL Lab menu.
-
Enter the following SQL script (adapt it accordingly, keeping the SQL commands
BEGIN;andCOMMIT;). For better readability, the SQL keywords are in capital letters):
The commands BEGIN; and COMMIT; are PostgresSQL specific.
They can only be used with databases where Allow DML is "True".
|
BEGIN;
CREATE VIEW country_population_density AS
    SELECT
        cc.*,
        fb.population,
        fb.area,
        CASE
            WHEN fb.area = 0
            THEN 0
            ELSE (fb.population / fb.area * 100)
        END AS density
    FROM "country_codes" AS cc
    JOIN "factbook_data" AS fb
    ON cc.country_name = fb.country_name
;
COMMIT;
The attribute country_codes contains the names of the countries and their ISO 3166-1 alpha-3 codes, factbook_data the names and other country-specific data (numerical values).
These tables are linked so that those numbers can be visualized on the World Map.
In this example it is the population number, the area and the population density.
|
-
In the SQL Editor execute the button Run Query.
-
Switch to the table list with the menu Source > Tables.
-
Add a new entry in the table list by clicking on "+" in the upper right corner. A dialog "Import a table definition" appears.
-
In the "Import a table definition" dialog, add the name of the view you just created as the "Table Name".
Now the view can be used like a table (see menu Source > Tables), typically to create a chart.
|
If an error occurs during Run Query — the execution of the SQL script --, this can have several causes:
|
The population density is, as already mentioned, the ratio between population and area, i.e. an attribute characteristic 'Ratio' per geometry data type 'Area'. According to the chapter "Assignment of geodata to map types", the choroplethic map is suitable for this purpose. In Superset these are the World Map and the Country Map.
| Links using a normal view — as explained above — can increase the duration considerably until a chart is displayed. With appropriate SQL scripts, the query can be accelerated, but further SQL and PostgreSQL knowledge is required. |
Using the SQL database language with Superset
The workflow shown in the previous chapter, which involved linking tables, opens up the extensive possibilities of the SQL database language. The workflow can also be used on only one table, for example to preprocess data.
| If you want to get to know SQL better, there is a variety of sources. An entertaining introduction for beginners is SQL Island. We are happy to receive feedback (see OpenSchoolMaps > Contact) and give further tips. |
Here is an example script with a SQL window function that compares the use and production of electricity in a country and calculates averages:
BEGIN;
CREATE VIEW electricity_usage AS
    WITH temporary AS (
        SELECT
            country_name,
            electricity_production, electricity_consumption,
            CASE
                WHEN electricity_production = 0
                THEN 0
                ELSE (electricity_consumption / electricity_production * 100)
            END AS percentage
        FROM factbook_data
    )
    SELECT
        *,
        AVG(electricity_production) OVER () AS avg_production,
        AVG(electricity_consumption) OVER () AS avg_consumption
    FROM temporary
    WHERE percentage IS NOT NULL
    ;
COMMIT;
Data types
A data type determines the allowed value range of an attribute. Examples of data types are text or integers.
Superset knows the following basic data types:
| Text |
Displayed in Superset with the icon "ABC". These can be, for example, the types |
| Timestamp |
Displayed in Superset with the icon "Clock". This is a "temporal" i.e. a temporal type with date and time. A temporal data type can be stored with or without a time zone. These data types are technically called |
| Number |
Shown in Superset with the icon "#". These are integers in Apache Superset. Technically they are called |
| Floating point number and fixed point number |
No icons in Superset. Technically these are called |
| Metrics |
In Superset represented as "f". Aggregation type, e.g. |
Time data is important in any data analysis. They are used, among other things, to filter the data. The fact that an attribute is of type Timestamp is determined by its attribute type directly in the database table, in addition to the temporary type flag that has to be set manually in Superset. (For the table view, checkbox is temporal under Columns).
There are more basic data types (for example, CHAR(3) and BOOLEAN) than those in Apache Superset mentioned above.
| Switzerland is in the Central European Time (CET) time zone. This refers to the 15th degree of longitude east. The difference between CET and Coordinated Universal Time (UTC) is one hour, which is expressed by +1. During the summer half-year in Europe/Switzerland, the difference to UTC is effectively +2 hours. |
Data type roles and spatial data types
The above-mentioned basic data types alone do not meet the diverse requirements of data. Like temporal data, spatial data are interesting for analysis and visualization. Spatial data types - often also called geodata - have special properties. Superset therefore requires the additional specification of a "Data type role " such as "Point" for certain charts. For the database, this data is still of the basic data type text, but Superset can interpret it specifically. By specifying the data type role, Superset is able to visualize data as map charts, for example.
Geometry is a known spatial data type. The four most important geometry data types are called standardized Point ( point synonyms: coordinate, point coordinate, location, position), LineString (line synonyms: polyline, way) and Polygon as well as "volume". A point determines the position of an object and consists of a pair of coordinates. For the international indication of positions on earth — for example with the GPS — longitudes and latitudes are used (abbreviated: Lon/Lat).
Overview of spatial data type roles in Apache Superset:
| Datatype role "Point" |
Is mainly available as role "Longitude & Latitude columns". The corresponding datatype encodings are "Delimited" or "Geohash" (more below). |
| Data type role "Longitude & Latitude columns" |
Two inseparably linked attributes in the table, longitude and latitude, which are of the floating point data type (e.g. floating point number float8). This role is a variation of the data type role "Point". |
| Data type role "LineString" |
Attributes of the basic data type Text (ABC in Superset), which have the data type encodings "JSON" or "Polyline" (WKT). |
| Data type role "Polygon" |
Attributes of the basic data type Text (ABC in Superset) that have the data type encoding "JSON". In addition, there is the data type encoding "Polyline" (WKT) and "ISO 3166-2 Codes". |
Longitude and latitude are based on a worldwide uniform geodetic coordinate system, the "World Geodetic System 1984" (WGS 84).
Lat/Lon are often treated as floating point numbers.
For most applications, a fixed point number with a maximum of 6 decimal places is sufficient, i.e. NUMERIC(9,6) (example from Lat/Lon for Rapperswil, which can be checked at www.osm.org: 47.22666, 8.81644).
|
The following chapter explains what is meant by data type encoding.
Data type encodings
Specifying a data type and a "data type role" is not enough: It must also be specified how the content of a data type is coded. This is called data type encoding.
| Problems with umlauts(ä,ö,ü) are known to many people. These problems have to do with the data type encoding of the data type text. Text has encodings such as UTF-8, ANSI or ASCII. We recommend UTF-8 in any case! |
Coordinates are not the only way to position and determine the position of objects. There are also other georeferencing systems, such as the so-called ISO 3166-2 codes and the Geohashes. All georeferencing systems - coordinate, ISO 3166-2 code and geohash - have their own codes.
The following data type encodings occur in Superset:
-
With the data type role "Point" it is "Delimited" or "Geohash".
-
For the data type role "LineString" (Line), it is "Polyline" or "JSON".
-
For the data type role "Polygon" (closed objects) they are "Polyline" or "ISO 3166-2 Codes".
Below is some information about the data type encodings:
| Delimited |
For example "47.22311, 8.81636" are the coordinates of building 4 of HSR Rapperswil. Seehttps://www.openstreetmap.org/search?query=47.22311,8.81636[OpenStreetMap] (note the link address). |
| Geohash |
Geohashing is a geo-referencing system that encodes a geographical location in a short sequence of letters and numbers. It is a hierarchical spatial data structure where the earth is divided into tiles that can be further subdivided. Letters and numbers are assigned to the tiles. This means that the longer a Geohash code is, the more accurate the location. Geohash codes are freely documented on Wikipedia and, compared to coordinates, have the property that they are short character strings. Geohashes are also used by OpenStreetMap and Geocaching. If you take the coordinates of building 4 of HSR Rapperswil (47.22311, 8.81636) as an example, you get the geohash "u0qk8seys1d". You can check this with Webapp Geohash.org. |
| Polyline (WKT) |
This is actually an encoding according to "Well Known Text" (WKT). An example is "LineString(47.22311 8.81636, 47.22469, 8.8173)" for the air line between HSR and Rapperswil station. See e.g. WKT on Wikipedia. |
| JSON |
JSON as abbreviation of "JavaScript Object Notation" is a data format in a human readable text form for the purpose of data exchange between web applications. Here, in connection with map charts, JSON actually means GeoJSON. GeoJSON is a standardized data format to represent geographic data according to the Simple Feature Access specification. GeoJSON can be displayed and edited with the website geojson.io. And with the web tool geojsonlint.com GeoJSON data can be checked. |
| ISO 3166-2 code |
Map charts such as Country Map and World Map can also process ISO 3166-2 codes of countries and their subdivisions (Swiss cantons, French departments, Canadian provinces). ISO 3166-2 is part of the ISO 3166 standard published by the International Organization for Standardization (ISO). See also Apache Superset documentation and Wikipedia. |
Geocoding
Geographical names such as "Rapperswil" or addresses such as "Oberseestrasse 10, Rapperswil-Jona" also form a kind of textual georeferencing system, albeit an ambiguous one. The interpretation of geographical names is an elaborate process and is called geocoding.
Geocoding is an algorithm and a process that converts a description of a position (location) — for example, a geohash, a postal address, or a place name — into a coordinate on the Earth’s surface.
Here as an example of a geocoding of the building address "Oberseestrasse 10, Rapperswil-Jona" a geocoding call with OpenStreetMap: https://map.search.ch/Rapperswil,Oberseestr.10 .
| Apache Superset currently does not include geocoding of building and postal addresses in addition to ISO 3166-2 codes and geohashes. It is always possible to link geographical names (abbreviations) with codes by linking them to another table: See the example in the chapter above "Using Superset to link one table to another". |
The Visualization Process and the Superset Map Charts
Visualization means to map data to graphical symbols or diagrams. Apache Superset is also structured in this way: The visualization process begins with the selection of the data source (table), then a suitable chart is selected, and finally the chart is assigned to a dashboard.
Data types help to simplify the decision to select a chart or map type. At the beginning of this visualization process, it is worth getting familiar with the data. This is the domain of descriptive statistics and data engineering. Those who know the characteristics of an attribute will find the charts in question faster.
Qualitative and quantitative One differentiates between qualitative and quantitative attribute characteristics. Qualitative characteristics are those that cannot be directly captured by numbers; their data type is usually text. Examples include first names, company names, etc. Quantitative characteristics, on the other hand, can be determined by numbers. These characteristics can be determined by weighing, measuring, counting, and so on.
Attribute characteristic levels For their part, the quantitative characteristics can be differentiated into four "attribute-characteristic levels" (source: Stanley Stevens, 1946, "One the theory of Scales of Measurement"):
| Nominal |
A name, class name ("something named"). Mostly data type Text. |
| Ordinal |
An ordinal number, a ranking, ("something to compare"). Mostly data type integer. |
| Interval |
A scaleless numerical value, ratio ("something relative"). Usually data type Floating point or fixed point number. |
| Ratio |
A numerical value with absolute zero point; usually data type floating point or fixed point number. |
Map types
In geovisualization, the visualization process described above is applied to geodata and maps. The geodata is assigned to the map symbols; this is called symbolisation.
There are theoretically the following map types:
-
Location maps
-
Network maps
-
Choropleth maps
-
Geographical maps
The map types from cartography help to group the Superset Map Charts. Only the most popular map types are presented here. Superset does not cover all map types, but currently provides twelve different map chart types (see also the appendix):
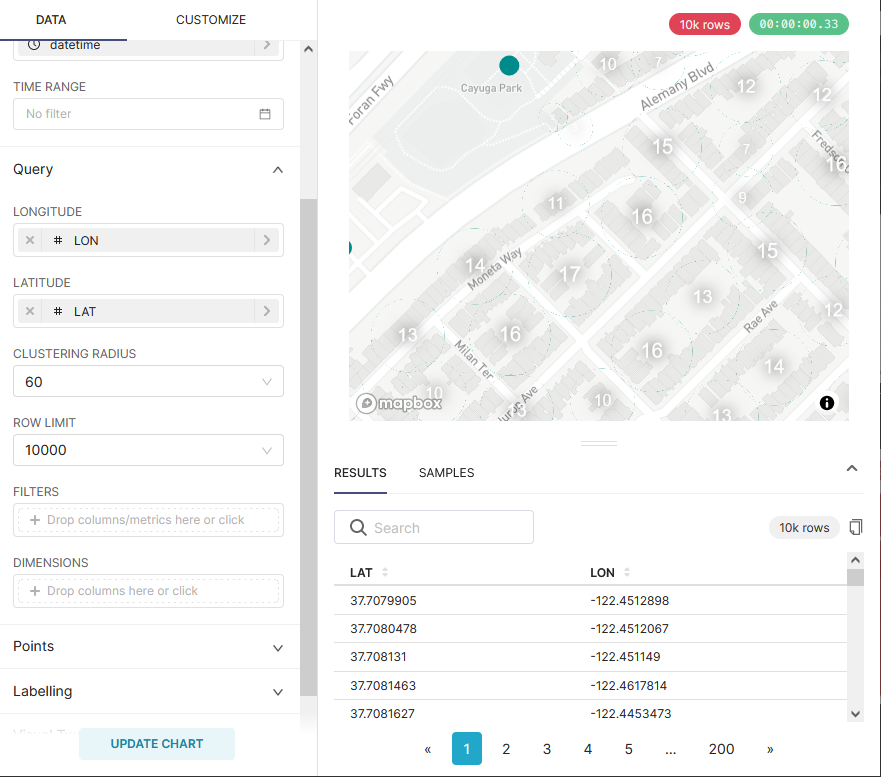
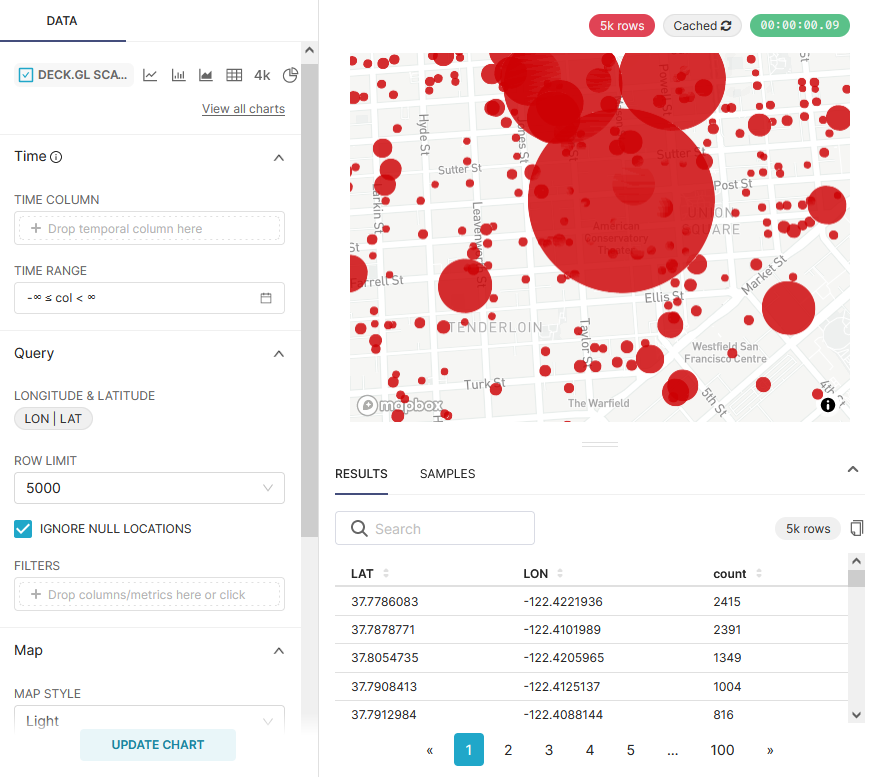
Location maps (Dot Map) are symbolized with point signatures (e.g. red symbols/markers) related to points/locations. The following superset charts belong to this map type:
| Mapbox |
Location map with point clustering. Expects the data type role "Longitude & Latitude columns". |
| Deck.gl Scatterplot |
Location map without point clustering. Expects the data type role "Longitude & Latitude columns". |
Mapbox |
Deck.gl Scatterplot |
| Point clustering is the "merging" of points when zooming out. See figures 1 and 2 in the appendix. |
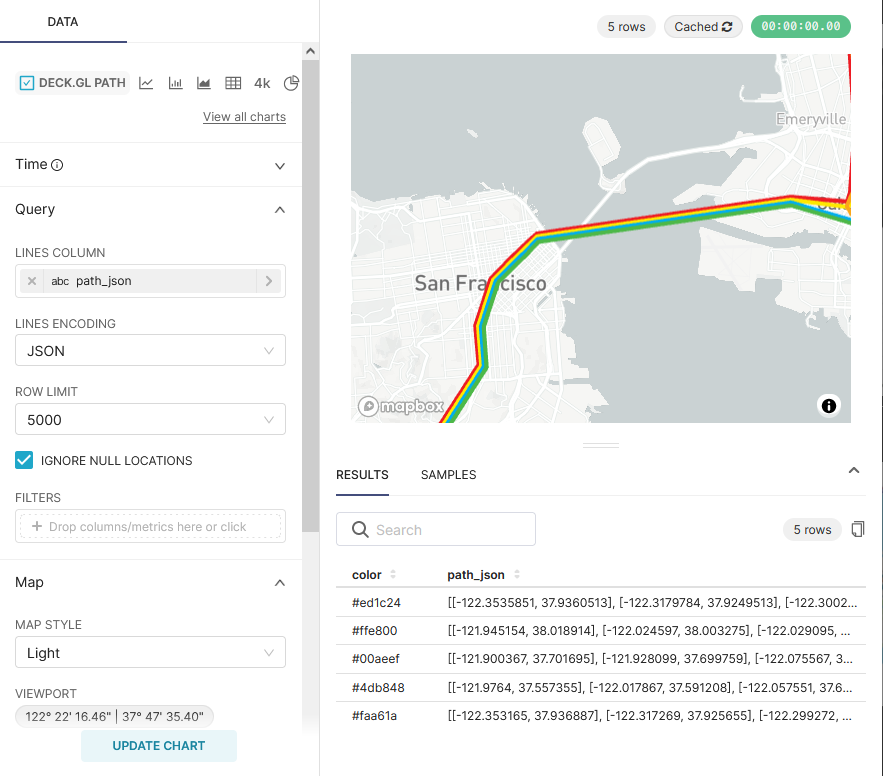
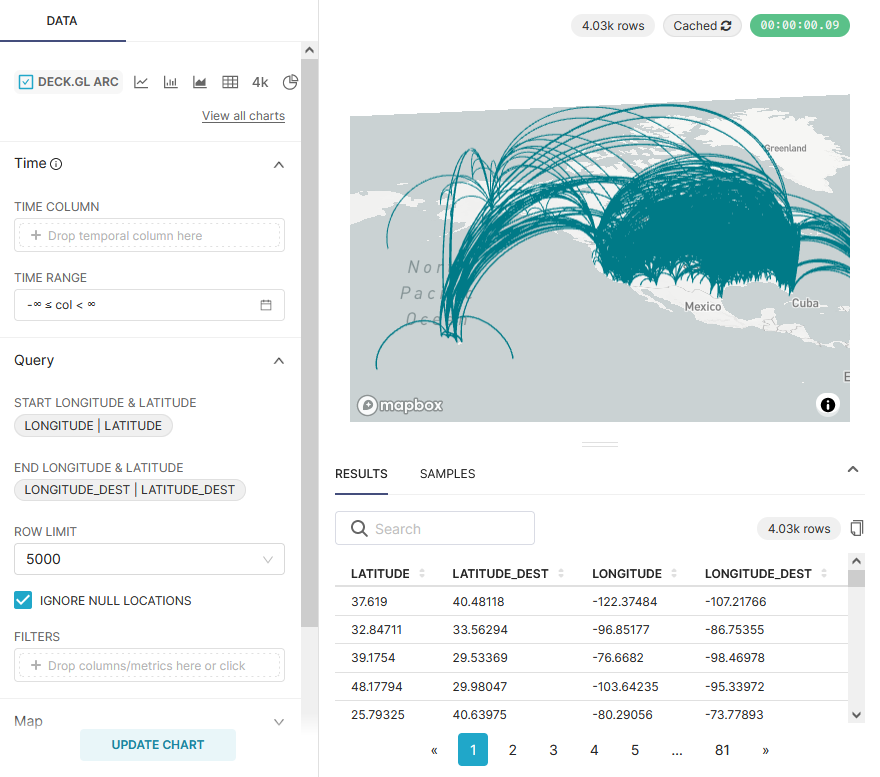
Network maps are symbolized with line signatures (e.g. red lines) related to lines. The following Superset Charts belong to this map type:
| Deck.gl Path |
Network map. Expects the data type role "LineString". |
| Deck.gl Arc |
Network map with lines consisting of 2 endpoints representing the shortest distance curves on the earth’s surface (orthodromes), for example to visualize flights or ship routes. Expects the data type role "Longitude & Latitude columns". |
Deck.gl Path |
Deck.gl Arc |
Choropleth maps (synonyms: density mosaic maps; area maps) are symbolized with area signatures related to areas. The values here are usually not absolute, but relative. The following superset charts belong to this map type:
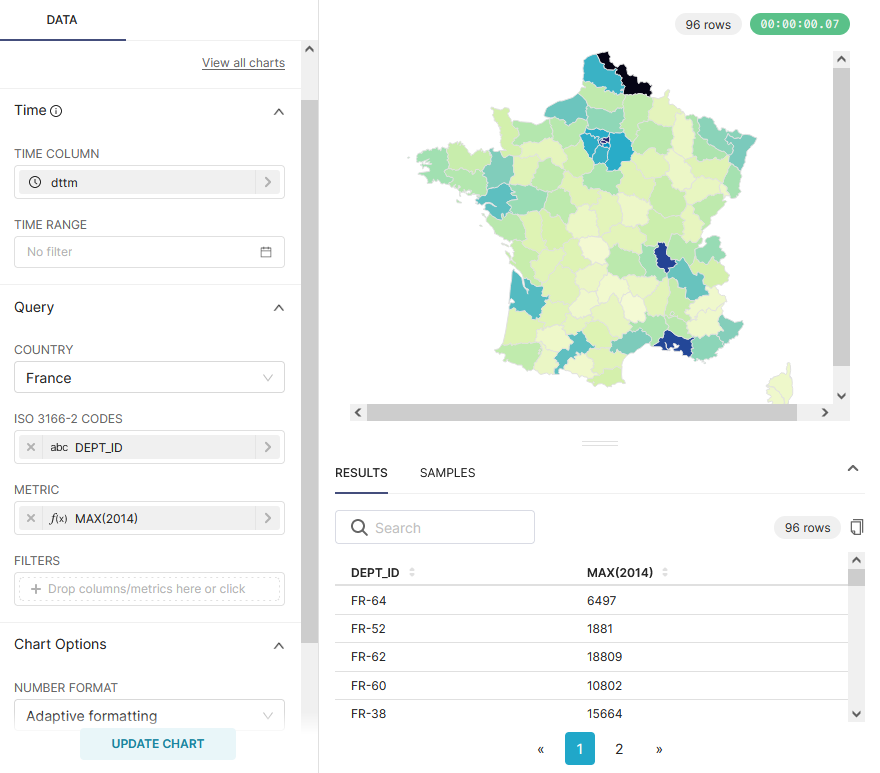
| Country Map |
Choropleth map with country borders. Expects ISO 3166-2 codes of countries and their subdivisions as a string. |
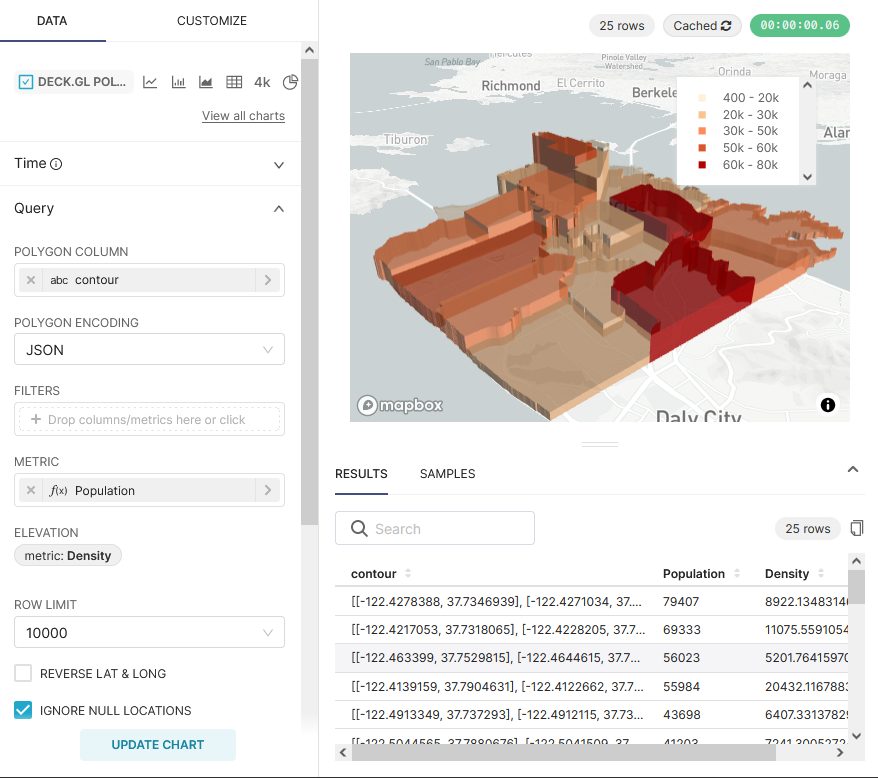
| Deck.gl Polygon |
Choroplethic map with areas. Expects the data type role "Polygon". |
Country Map |
Deck.gl Polygon |
| A common error in choropleth maps is when the displayed values are absolute, for example "sum of tractors per country". Correct would be a relative indication like "tractors per km2", i.e. the absolute sum is divided by the land area. |
Location maps (en. Symbol Map) are symbolized with local business diagrams related to locations or areas. Note the difference from symbol/marker to diagram. The following superset charts belong to this map type:
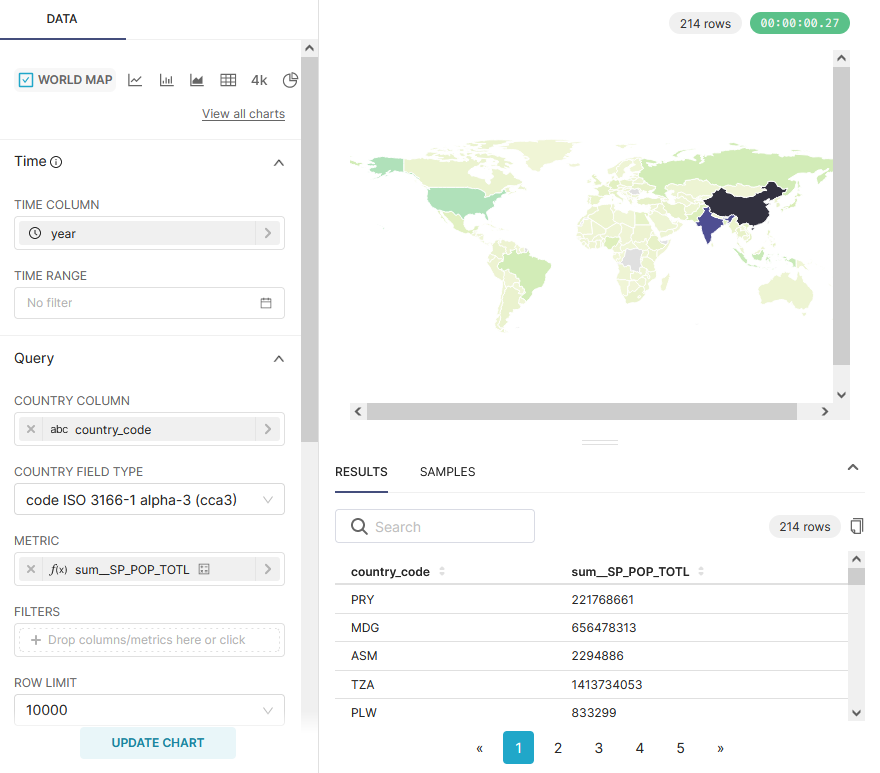
| World Map |
2D city map. Expects ISO 3166-2 codes of countries and their subdivisions as a string. |
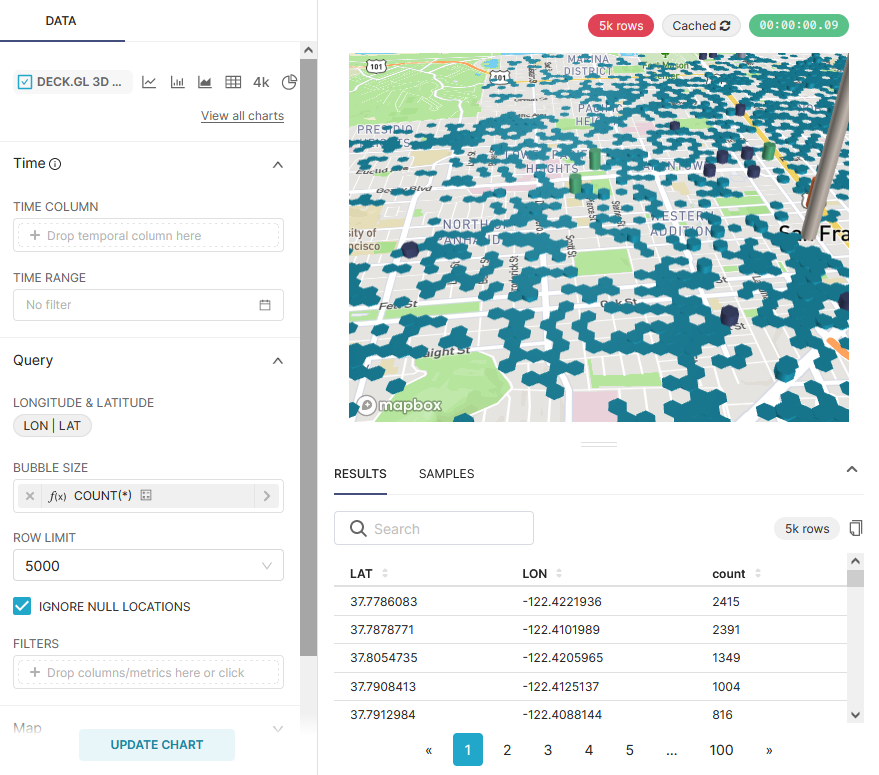
| Deck.gl 3D Hexagon |
Geographical map 3D. Expects the data type role "Longitude & Latitude columns". |
| Deck.gl Grid |
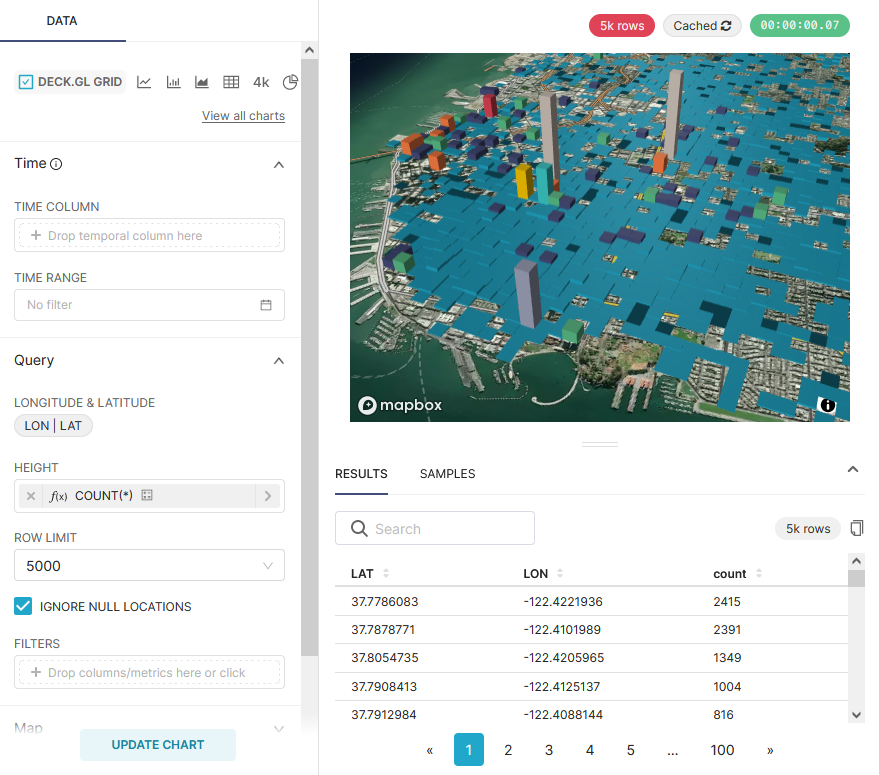
Variant of Deck.gl 3D Hexagon, but with rectangular columns. Expects the data type role "Longitude & Latitude columns". |
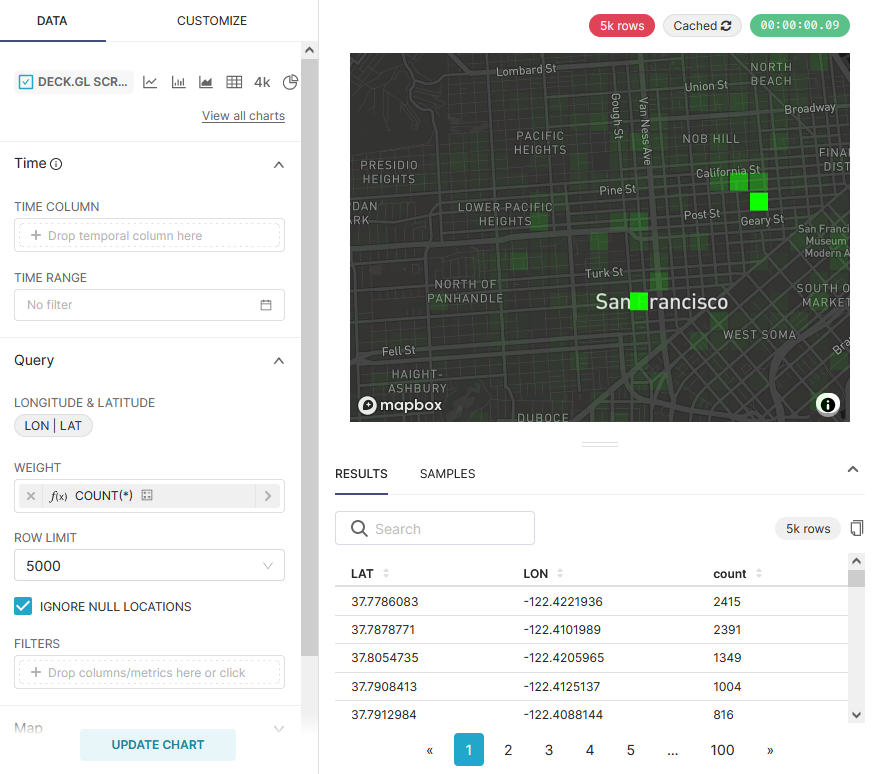
| Deck.gl Screen Grid |
Similar to Deck.gL Grid and Hexagon. Expects the data type role "Longitude & Latitude columns". |
| Deck.gl GeoJSON |
Does not work in Superset at the moment! |
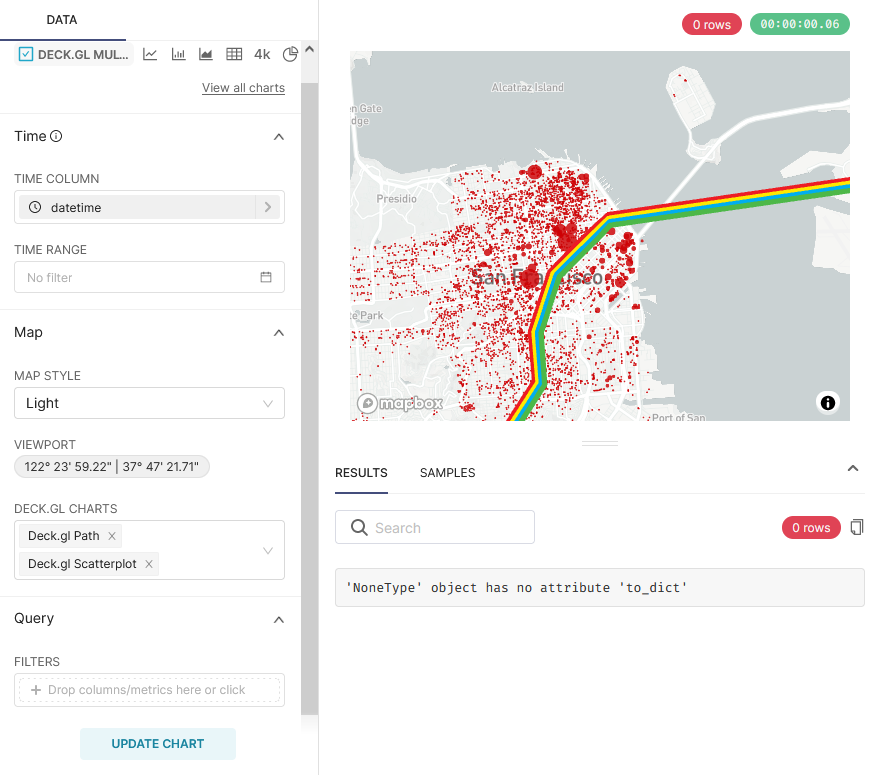
Another Map Chart is Deck.gl Multiple Layers. This "Chart" allows the combination of several Deck.gl charts, together with a base map.
World Map |
Deck.gl 3D Hexagon |
Deck.gl Grid |
Deck.gl Screen Grid |
Deck.gl Multiple Layers |
| This is only a selection of the most important card types. It is incomplete. A possible source for reading is GITTA.info. |
Assignment of geodata to map types
The table below shows the mapping of geometry data types on the horizontal axis and attribute-characteristic levels on the vertical axis to map types:
| Point | Line | Area | |
|---|---|---|---|
Nominal |
Dot map |
Network map |
Colored area map |
Ordinal. |
Symbol map |
Ordered network map |
Ordered colored map |
Interval. |
Graduated symbol map |
Flow map |
Choropleth map |
Ratio |
From experience, the most frequently used map charts are Mapbox (map type Dot Map) if the geometry data type is point, and Country Map (Choropleth Map) if the geometry data type is area.
Customize charts and dashboards
Dashboard options
A dashboard can overwrite the display configuration (e.g. chart colors) of the charts. This is possible by editing the metadata of a dashboard. The settings can be found under Dashboard→ Edit record. Here you will find a text field called "JSON Metadata". This could look like this (it could also be empty):
{
  "filter_immune_slices": [],
  "timed_refresh_immune_slices": [],
  "filter_immune_slice_fields": {},
  "expanded_slices": {},
  "refresh_frequency": 0,
  "default_filters": "{}"
}
The parameters generally apply to all dashboards:
-
filter_immune_slices: Array of slice_ids (int) of charts that should not be filtered.
"filter_immune_slices": [324, 65, 92],
-
timed_refresh_immune_slices: Array of slice_ids that should not be reloaded automatically by the browser.
"timed_refresh_immune_slices": [324]
-
filter_immune_slice_fields: Here you can set whether specific fields should not be filterable for certain charts.
{
    "Filter slice fields.
        "177": ["country_name", "__time_range"],
        "32": ["__time_range"]
    }
}
-
refresh_frequency: Number of seconds until the browser automatically reloads the data from the server (integer in seconds).
"refresh_frequency": 5
-
default_filters: Sets default values in the filter. The slice_id of the filter must be given.
"default_filters": "{\"95\": {\"country_name\": [\"Kenya\"]}}"
| The slice_id can be found in the chart metadata under Parameter. If your chart has no ID you have to save it again. |
Defining chart colors in the dashboard
For the desired colors to be applied in the dashboard, the color scheme Airbnb Colors must be selected for the individual charts under Customize.
|
To change the color of a chart, you must add "label_colors": {"key": "color"},. Here is an example of what this might look like:
{
  "label_colors": {
    "girl": "#0200ff",
    "boy": "#00ff00"
  },
  "filter_immune_slices": [],
  "timed_refresh_immune_slices": [],
  "filter_immune_slice_fields": {},
  "expanded_slices": {},
  "refresh_frequency": 0,
  "default_filters": "{}"
}
You can find the "keys" like "girl" in the legend of the respective chart.
| All options must be valid JSON. The "JSON Editor Online" can help with the editing. |
Customize tooltips with JavaScript
Each point at e.g. Scatterplot shows its longitude and latitude as tooltip text. The tooltip text can be found in the Javascript tooltip generator of the chart under Advanced. customizable.
| JavaScript must be enabled for this adaptation (ENABLE-JAVASCRIPT-CONTROL). Contact the Sys-Admin if necessary. |
In the text field you have to write a function which returns a string which is then displayed as a tooltip. Here is a simple example which sets the tooltip to "test":
function myFunction(dot) {
    return 'test'
}
To get a more useful tooltip, you first have to select the data you want to use. This is done by adding the columns under Extra data for JS.
If you now want to display a tooltip for each point, with information from a column named "Name", you have to write the function like this:
function myFunction(dot) {
    return dot.object.extraProps.Name
}
| The function must be valid JavaScript code. JavaScript is a computer language that requires appropriate knowledge and tools. |
Supplement charts with annotations
Annotations are text and graphic notes that can be placed over charts as annotations. Depending on the annotation type, it is either a line or a colored rectangle in the background. They can be used to display general information (e.g. global population growth) without having to store it as data in a table.
Annotation Layers are used to bundle annotations. A layer can contain several annotations and you include the annotation layer in diagrams, which then represents all annotations.
There are four annotation types:
| Event |
Based on table data, is displayed as a line. |
| Interval |
Like Event, but with start and end date, rendered as "Range". |
| Time (Time Series) |
Line based on any Time Series. |
| Formula |
Line based on a formula (e.g. 2x or 0.005x). |
Creating annotations
Event and interval annotations can be created in Annotations under Manage in the Superset menu bar. The Long Description of an annotation is displayed in the chart as a description text of the event or interval. The start and end date is used for the Interval as time span, the event only the start date as fixed time. This type of annotation must be added to a annotation layer. can be added.
Event and interval annotations can also be created with a Table. In the database table, there should be a column for the annotation, one for the description (text), one for the start date (Date) and possibly for the end date (Date).
| The database table cannot be referenced directly in the Annotations and Layers. A Table with that table, which visualizes all required columns, must first be created. This Table then serves as Annotation Source of the other diagram. |
The data for time annotations are fetched from any Line Chart. Its "course" can be visualized in other diagrams with a time axis.
Event annotations
Events are a list of times (dates) with descriptions. They are displayed as vertical lines. Their description is displayed in the tooltips when you move the mouse over them.
Interval annotations
Just like events, but with a start and end date, they are displayed as a range.
Time series annotations
Time series are added as an additional line on the line chart. The name and display properties can be configured.
Formula annotations
Formulas are inserted into the diagram as additional lines. You can enter a mathematical expression, which is evaluated on the client side with "mathjs". You can set the display properties and specify any mathematical formula.
ANNEX: The eleven map charts of Apache Superset
Here you can see the eleven map charts of Apache Superset and their choices. A red box indicates which parameters are needed to create the map.
| Many charts have a 'time_range'. It is preset to 'last week'. For example data, this must usually be set to 'no filter'. |
